- Name Feedlot Cattle Cost Of Gain And Mortality Feedlot Mortality Measures The Percent Of Cattle That Die While In The 1 (69.54 KiB) Viewed 25 times
- Name Feedlot Cattle Cost Of Gain And Mortality Feedlot Mortality Measures The Percent Of Cattle That Die While In The 2 (34.86 KiB) Viewed 25 times
- Name Feedlot Cattle Cost Of Gain And Mortality Feedlot Mortality Measures The Percent Of Cattle That Die While In The 3 (65.77 KiB) Viewed 25 times
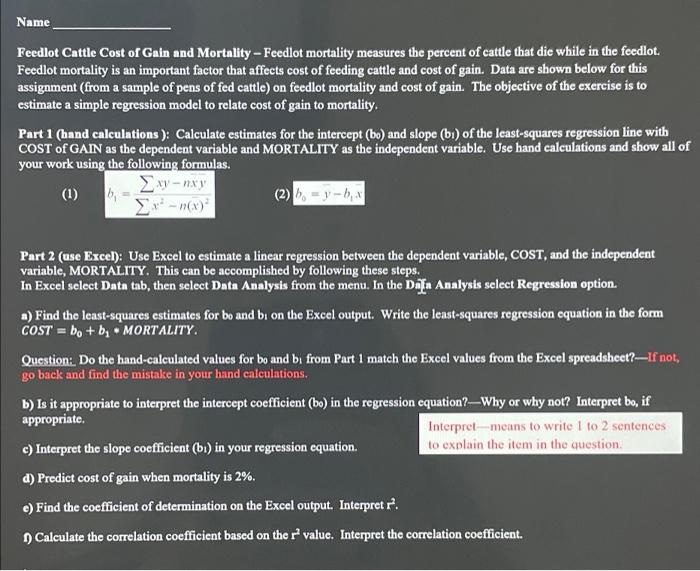
Name Feedlot Cattle Cost of Gain and Mortality - Feedlot mortality measures the percent of cattle that die while in the feedlot. Feedlot mortality is an important factor that affects cost of feeding cattle and cost of gain. Data are shown below for this assignment (from a sample of pens of fed cattle) on feedlot mortality and cost of gain. The objective of the exercise is to estimate a simple regression model to relate cost of gain to mortality. Part 1 (hand calculations): Calculate estimates for the intercept (bo) and slope (bi) of the least-squares regression line with COST of GAIN as the dependent variable and MORTALITY as the independent variable. Use hand calculations and show all of your work using the following formulas. (1) b₁ Exy-nxy Σx²-n(x)² (2) b =y-b₁x Part 2 (use Excel): Use Excel to estimate a linear regression between the dependent variable, COST, and the independent variable, MORTALITY. This can be accomplished by following these steps. In Excel select Data tab, then select Data Analysis from the menu. In the Data Analysis select Regression option. a) Find the least-squares estimates for bo and bi on the Excel output. Write the least-squares regression equation in the form COST = bo + b₂ MORTALITY. Question: Do the hand-calculated values for bo and bi from Part 1 match the Excel values from the Excel spreadsheet?-If not, go back and find the mistake in your hand calculations. b) Is it appropriate to interpret the intercept coefficient (bo) in the regression equation? Why or why not? Interpret bo, if appropriate. Interpret-means to write 1 to 2 sentences c) Interpret the slope coefficient (bi) in your regression equation. to explain the item in the question. d) Predict cost of gain when mortality is 2%. e) Find the coefficient of determination on the Excel output. Interpret r². 1) Calculate the correlation coefficient based on the r' value. Interpret the correlation coefficient.
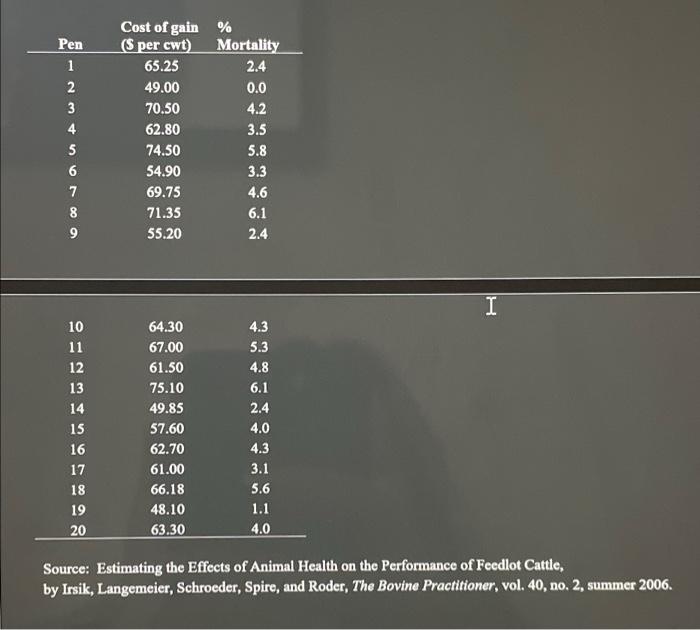
Cost of gain (S per cwt) 65.25 49.00 70.50 62.80 74.50 54.90 69.75 71.35 55.20 I 10 64.30 11 67.00 12 61.50 13 75.10 14 49.85 15 57.60 16 62.70 17 61.00 18 66.18 19 48.10 1.1 20 63.30 4.0 Source: Estimating the Effects of Animal Health on the Performance of Feedlot Cattle, by Irsik, Langemeier, Schroeder, Spire, and Roder, The Bovine Practitioner, vol. 40, no. 2, summer 2006. Pen 1 2 3 4 5 6 6749 % Mortality 2.4 0.0 4.2 3.5 5.8 3.3 4.6 6.1 2.4 8 4.3 5.3 4.8 6.1 2.4 4.0 4.3 3.1 5.6
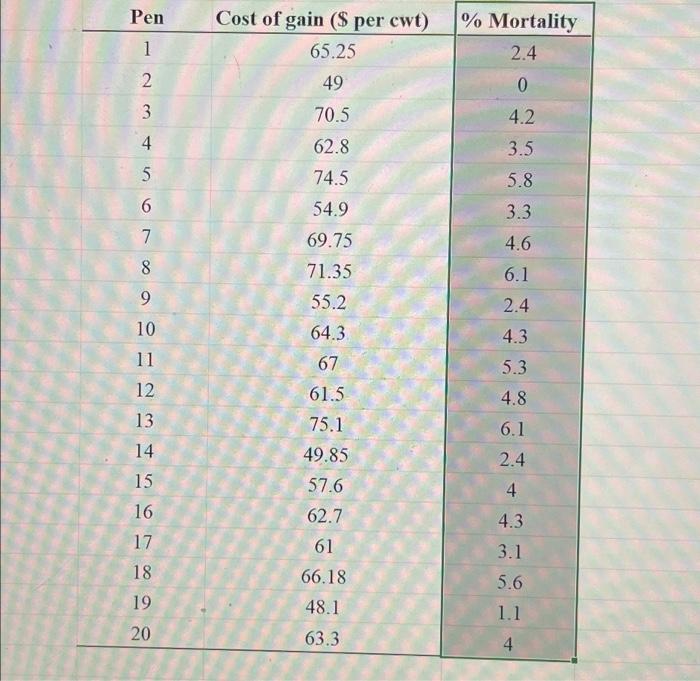
Pen 1 2 234 5 69 7 8 9 10 11 12 13 4561898 17 20 Cost of gain ($ per cwt) 65.25 49 70.5 62.8 74.5 54.9 69.75 71.35 55.2 64.3. 67 61.5 75.1 49.85 57.6 62.7 61 66.18 48.1 63.3 % Mortality 2.4 0 4.2 3.5 5.8 3.3 4.6 6.1 2.4 4.3 5.3 4.8 6.1 2.4 4 4.3 3.1 5.6 1.1