- A Identify And Compute The Most Appropriate Measure Of Central Tendency For Each Case 1 The Scores Of 10 Randomly Sel 1 (92.1 KiB) Viewed 45 times
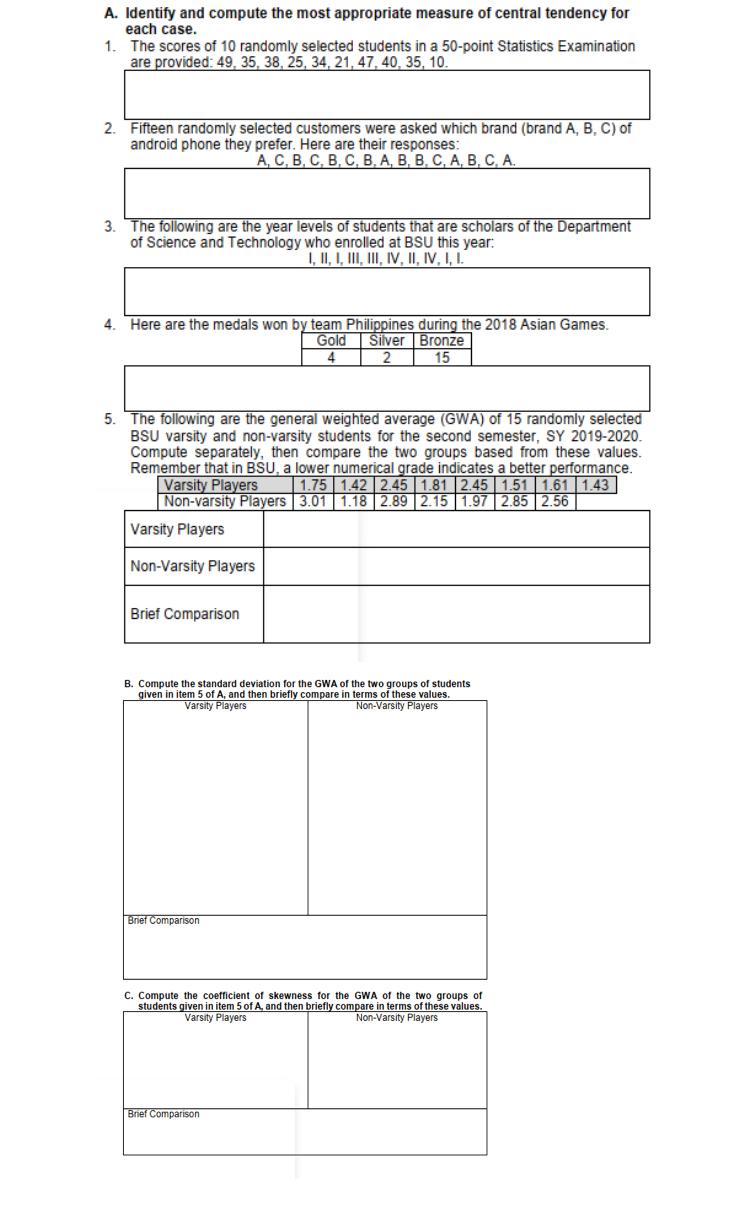
A. Identify and compute the most appropriate measure of central tendency for each case. 1. The scores of 10 randomly selected students in a 50-point Statistics Examination are provided: 49, 35, 38, 25, 34, 21, 47, 40, 35, 10. 2. Fifteen randomly selected customers were asked which brand (brand A, B, C) of android phone they prefer. Here are their responses: A, C, B, C, B, C, B, A, B, B, C, A, B, C, A. 3. The following are the year levels of students that are scholars of the Department of Science and Technology who enrolled at BSU this year: I, II, I, III, III, IV, II, IV, I, I. 4. Here are the medals won by team Philippines during the 2018 Asian Games. Gold Silver 4 2 Bronze 15 5. The following are the general weighted average (GWA) of 15 randomly selected BSU varsity and non-varsity students for the second semester, SY 2019-2020. Compute separately, then compare the two groups based from these values. Remember that in BSU, a lower numerical grade indicates a better performance. 1.75 1.42 2.45 1.81 2.45 1.51 1.61 1.43 Non-varsity Players 3.01 1.18 2.89 2.15 1.97 2.85 2.56 Varsity Players Varsity Players Non-Varsity Players Brief Comparison B. Compute the standard deviation for the GWA of the two groups of students given in item 5 of A, and then briefly compare in terms of these values. Varsity Players Non-Varsity Players Brief Comparison C. Compute the coefficient of skewness for the GWA of the two groups of students given in item 5 of A, and then briefly compare in terms of these values. Varsity Players Non-Varsity Players Brief Comparison