Page 1 of 1
Question B1 The pH values (pH) of 10 randomly selected samples of chemical solutions are recorded and then analysed by t
Posted: Wed May 04, 2022 11:56 am
by answerhappygod
- Question B1 The Ph Values Ph Of 10 Randomly Selected Samples Of Chemical Solutions Are Recorded And Then Analysed By T 1 (151.14 KiB) Viewed 27 times
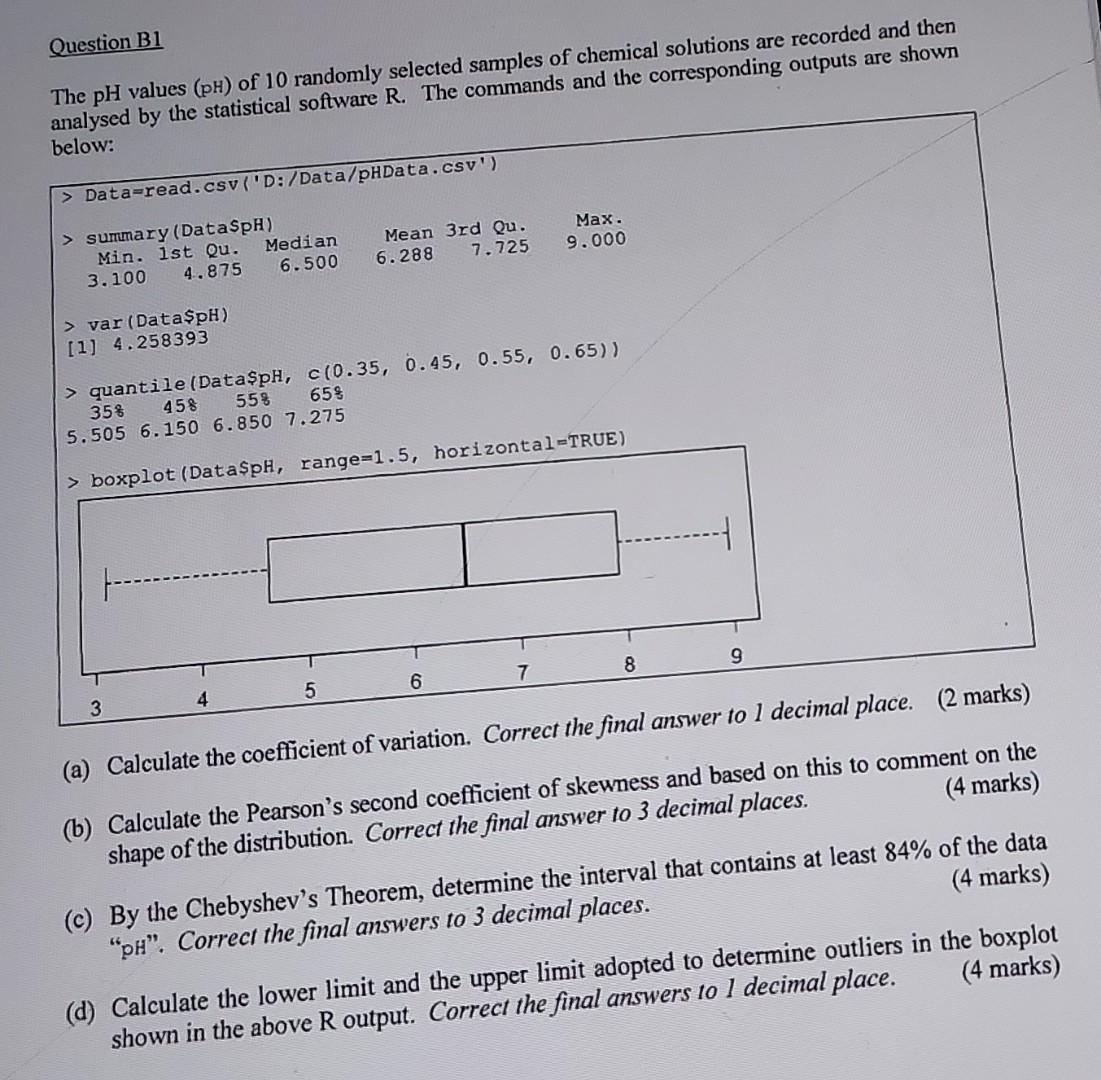
Question B1 The pH values (pH) of 10 randomly selected samples of chemical solutions are recorded and then analysed by the statistical software R. The commands and the corresponding outputs are shown below: > Data-read.csv ('D: /Data/pHData.csv') > summary (DataSpH) Min. 1st Qu. Median 3.100 4.875 6.500 Mean 3rd Qu. 6.288 7.725 Max. 9.000 > var (Data$pH) [1] 4.258393 > quantile (DataSpH, c(0.35, 0.45, 0.55, 0.65)) 35% 45% 55% 65% 5.505 6.150 6.850 7.275 > boxplot (DataSpH, range-1.5, horizontal=TRUE) 3 4 5 6 7 8 9 (a) Calculate the coefficient of variation. Correct the final answer to 1 decimal place. (2 marks) (4 marks) (b) Calculate the Pearson's second coefficient of skewness and based on this to comment on the shape of the distribution. Correct the final answer to 3 decimal places. (4 marks) (c) By the Chebyshev's Theorem, determine the interval that contains at least 84% of the data "PH". Correct the final answers to 3 decimal places. (4 marks) (d) Calculate the lower limit and the upper limit adopted to determine outliers in the boxplot shown in the above R output. Correct the final answers to 1 decimal place.