Page 1 of 1
Head of Time T Cd %Error (sec) Water H (m) Theoretical 5 13.75 0.038 5 16.25 0.036 5 19.75 0.033 5 32.3 0.030 5 35.2 0.0
Posted: Wed May 04, 2022 8:56 am
by answerhappygod
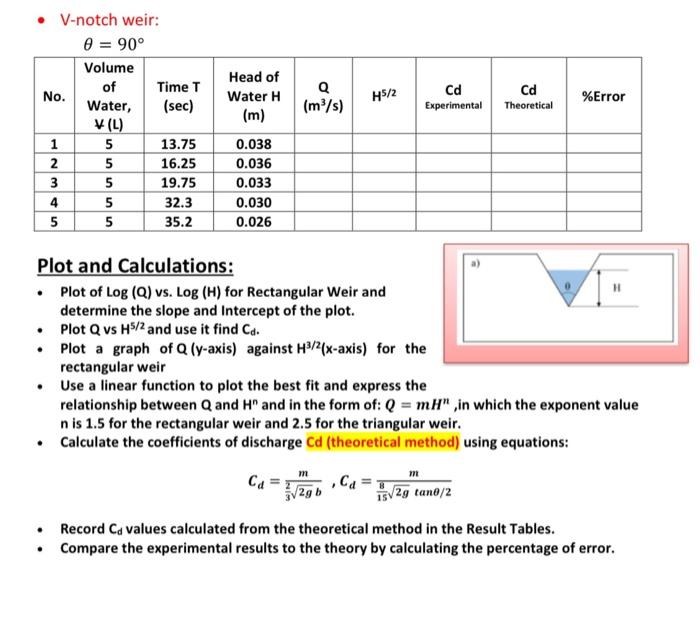
- Head Of Time T Cd Error Sec Water H M Theoretical 5 13 75 0 038 5 16 25 0 036 5 19 75 0 033 5 32 3 0 030 5 35 2 0 0 1 (62.83 KiB) Viewed 33 times
Head of Time T Cd %Error (sec) Water H (m) Theoretical 5 13.75 0.038 5 16.25 0.036 5 19.75 0.033 5 32.3 0.030 5 35.2 0.026 Plot and Calculations: • Plot of Log (Q) vs. Log (H) for Rectangular Weir and determine the slope and Intercept of the plot. • Plot Q vs H5/2 and use it find Cd. . Plot a graph of Q (y-axis) against H³/2(x-axis) for the rectangular weir • Use a linear function to plot the best fit and express the relationship between Q and HD and in the form of: Q = mH",in which the exponent value n is 1.5 for the rectangular weir and 2.5 for the triangular weir. Calculate the coefficients of discharge Cd (theoretical method) using equations: m m Ca Ca √2g tano/2 . Record Cd values calculated from the theoretical method in the Result Tables. Compare the experimental results to the theory by calculating the percentage of error. V-notch weir: 0 = 90° Volume of Water, (L) No. 1 2 3 45 4 Q (m³/s) H5/2 Cd Experimental