Page 1 of 1
The following figure shows a pipe network that include five loops with two feeding points, All the pipes and joints have
Posted: Wed May 04, 2022 8:48 am
by answerhappygod
- The Following Figure Shows A Pipe Network That Include Five Loops With Two Feeding Points All The Pipes And Joints Have 1 (51.44 KiB) Viewed 34 times
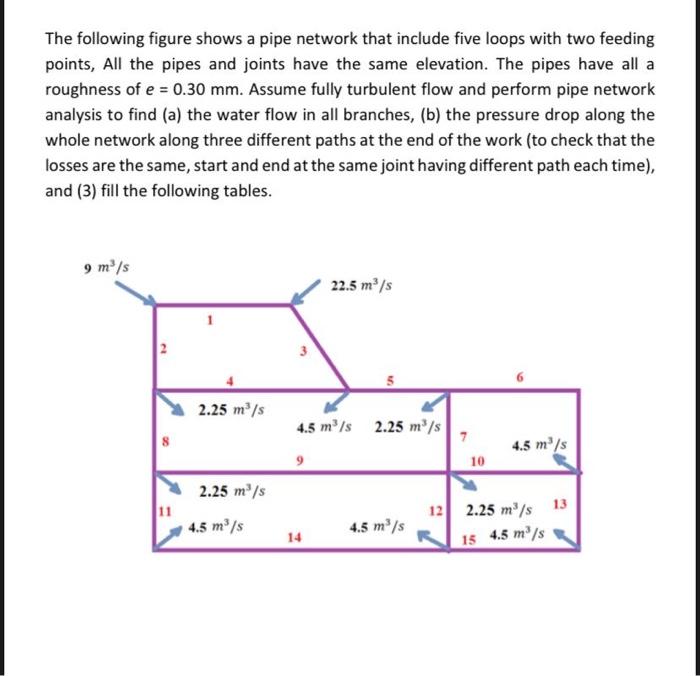
The following figure shows a pipe network that include five loops with two feeding points, All the pipes and joints have the same elevation. The pipes have all a roughness of e = 0.30 mm. Assume fully turbulent flow and perform pipe network analysis to find (a) the water flow in all branches, (b) the pressure drop along the whole network along three different paths at the end of the work (to check that the losses are the same, start and end at the same joint having different path each time), and (3) fill the following tables. 9 m³/s 22.5 m³/s 1 2.25 m³/s 4.5 m³/s 2.25 m³/s 4.5 m³/s 10 2.25 m³/s 12 2.25 m³/s 13 4.5 m³/s 15 4.5 m³/s 2 8 4.5 m³/s 14 7