Page 1 of 1
3. The exceedance-discharge-stage-damage data for existing conditions at a particular area along a river is given in the
Posted: Wed May 04, 2022 8:34 am
by answerhappygod
- 3 The Exceedance Discharge Stage Damage Data For Existing Conditions At A Particular Area Along A River Is Given In The 1 (299.05 KiB) Viewed 42 times
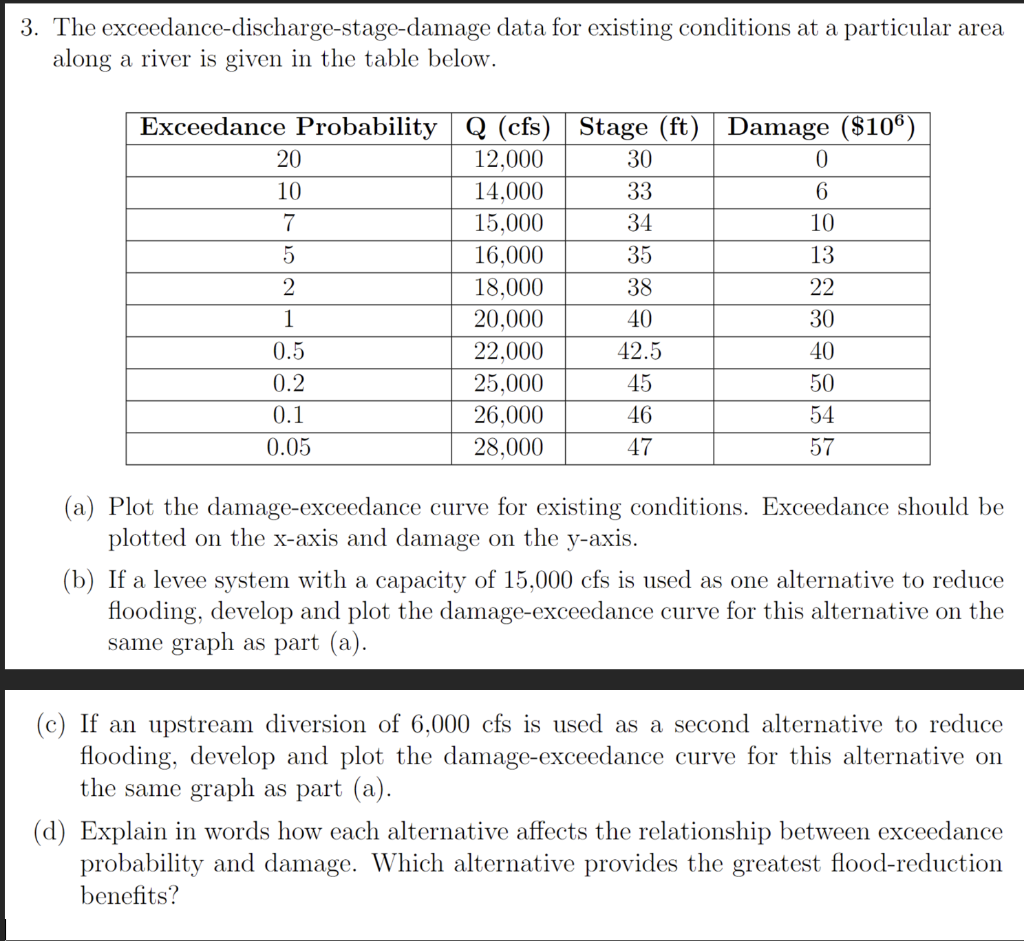
3. The exceedance-discharge-stage-damage data for existing conditions at a particular area along a river is given in the table below. Exceedance Probability Q (cfs) Stage (ft) Damage ($106) 20 12,000 30 0 10 14,000 33 6 7 15,000 34 10 5 16,000 35 13 2 18,000 38 22 1 20,000 40 30 0.5 22,000 42.5 40 0.2 25,000 45 50 0.1 26,000 46 54 0.05 28,000 47 57 (a) Plot the damage-exceedance curve for existing conditions. Exceedance should be plotted on the x-axis and damage on the y-axis. (b) If a levee system with a capacity of 15,000 cfs is used as one alternative to reduce flooding, develop and plot the damage-exceedance curve for this alternative on the same graph as part (a). (c) If an upstream diversion of 6,000 cfs is used as a second alternative to reduce flooding, develop and plot the damage-exceedance curve for this alternative on the same graph as part (a). (d) Explain in words how each alternative affects the relationship between exceedance probability and damage. Which alternative provides the greatest flood-reduction benefits?