Page 1 of 1
Star, Inc. used Excel to run a least-squares regression analysis, which resulted in the following output: Regression Sta
Posted: Wed May 04, 2022 6:24 am
by answerhappygod
- Star Inc Used Excel To Run A Least Squares Regression Analysis Which Resulted In The Following Output Regression Sta 1 (37.23 KiB) Viewed 38 times
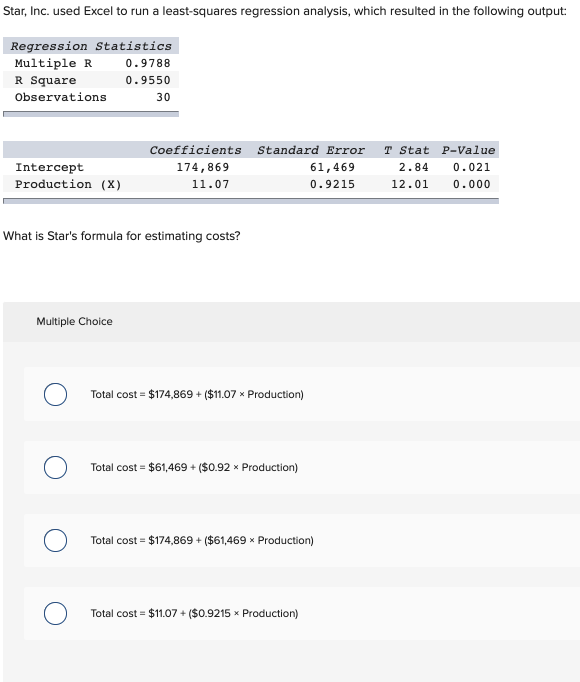
Star, Inc. used Excel to run a least-squares regression analysis, which resulted in the following output: Regression Statistics. Multiple R 0.9788 R Square 0.9550 Observations 30 Coefficients Standard Error T Stat P-Value 174,869 61,469 2.84 0.021 Intercept Production (X) 11.07 0.9215 12.01 0.000 What is Star's formula for estimating costs? Multiple Choice Total cost = $174,869 + ($11.07 x Production) Total cost = $61,469 + ($0.92 x Production) Total cost = $174,869 + ($61,469 × Production) Total cost = $11.07 + ($0.9215 x Production)