Page 1 of 1
Therefore, the simple phase line depicted in Figure 1.18(c), which indicates with dots and arrows only the zeros and sig
Posted: Mon May 02, 2022 5:21 pm
by answerhappygod
- Therefore The Simple Phase Line Depicted In Figure 1 18 C Which Indicates With Dots And Arrows Only The Zeros And Sig 1 (80.67 KiB) Viewed 27 times
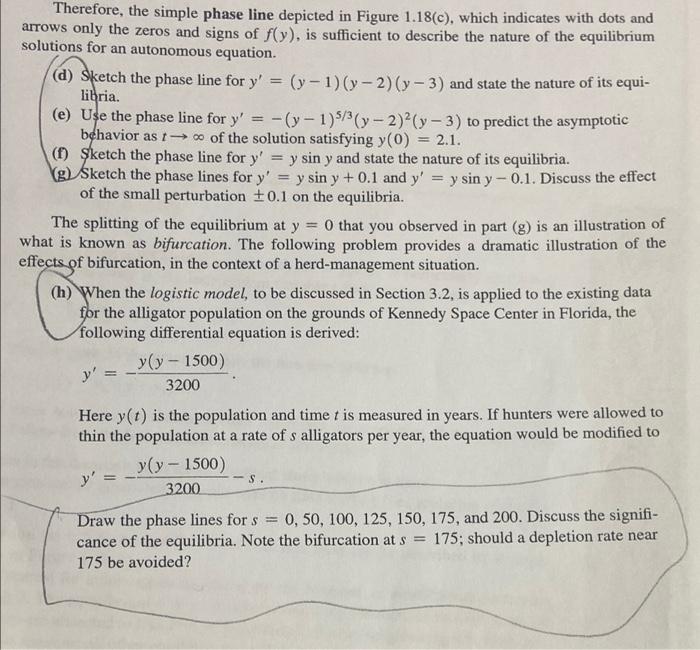
Therefore, the simple phase line depicted in Figure 1.18(c), which indicates with dots and arrows only the zeros and signs of f(y), is sufficient to describe the nature of the equilibrium solutions for an autonomous equation. (d) Sketch the phase line for y' = (y - 1)(y – 2)(y - 3) and state the nature of its equi- libria. (e) Use the phase line for y' = -(y - 1)53(y-2)(y - 3) to predict the asymptotic behavior ast of the solution satisfying y(0) = 2.1. - (1) sketch the phase line for y' = y sin y and state the nature of its equilibria. (g) Sketch the phase lines for y' = y sin y + 0.1 and y' = y sin y -0.1. Discuss the effect of the small perturbation +0.1 on the equilibria. The splitting of the equilibrium at y O that you observed in part (g) is an illustration of what is known as bifurcation. The following problem provides a dramatic illustration of the effects of bifurcation, in the context of a herd-management situation. (h) When the logistic model, to be discussed in Section 3.2, is applied to the existing data for the alligator population on the grounds of Kennedy Space Center in Florida, the following differential equation is derived: y(y - 1500) 3200 a Here y(t) is the population and time t is measured in years. If hunters were allowed to thin the population at a rate of s alligators per year, the equation would be modified to y(y - 1500) y' = 3200 - S. Draw the phase lines for s = 0, 50, 100, 125, 150, 175, and 200. Discuss the signifi- cance of the equilibria. Note the bifurcation at s = 175; should a depletion rate near 175 be avoided?