Page 1 of 1
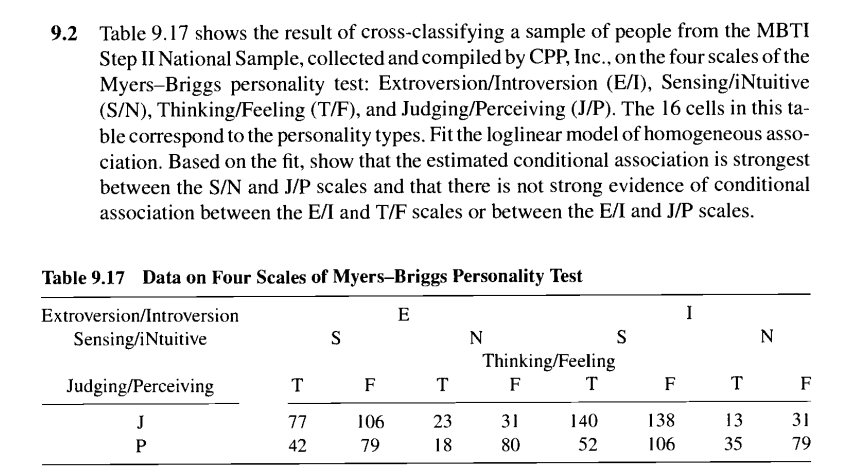
9.2 Table 9.17 shows the result of cross-classifying a sample of people from the MBTI Step II National Sample, collected
Posted: Mon May 02, 2022 5:18 pm
by answerhappygod
- 9 2 Table 9 17 Shows The Result Of Cross Classifying A Sample Of People From The Mbti Step Ii National Sample Collected 1 (95.05 KiB) Viewed 26 times
9.2 Table 9.17 shows the result of cross-classifying a sample of people from the MBTI Step II National Sample, collected and compiled by CPP, Inc., on the four scales of the Myers-Briggs personality test: Extroversion/Introversion (E/I), Sensing/iNtuitive (S/N), Thinking/Feeling (T/F), and Judging/Perceiving (J/P). The 16 cells in this ta- ble correspond to the personality types. Fit the loglinear model of homogeneous asso- ciation. Based on the fit, show that the estimated conditional association is strongest between the S/N and J/P scales and that there is not strong evidence of conditional association between the E/I and T/F scales or between the E/I and J/P scales. Table 9.17 Data on Four Scales of Myers-Briggs Personality Test Extroversion/Introversion E I Sensing/iNtuitive S N S N Thinking/Feeling Judging/Perceiving F T F T FT J 106 31 140 13 P 79 80 52 35 T 77 42 138 23 138 106 F 31 79