Page 1 of 1
22. The table below shows hypothetical results from a case-control study in which not all cases and not all controls agr
Posted: Mon May 02, 2022 4:29 pm
by answerhappygod
- 22 The Table Below Shows Hypothetical Results From A Case Control Study In Which Not All Cases And Not All Controls Agr 1 (73.13 KiB) Viewed 27 times
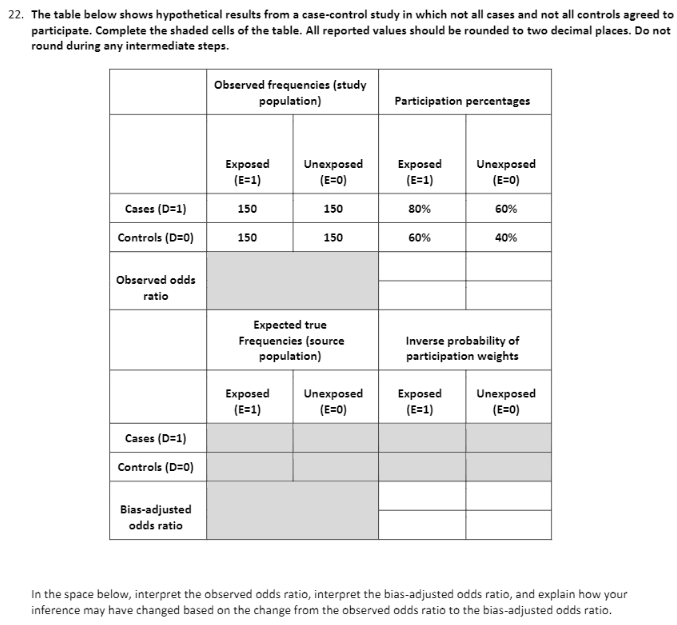
22. The table below shows hypothetical results from a case-control study in which not all cases and not all controls agreed to participate. Complete the shaded cells of the table. All reported values should be rounded to two decimal places. Do not round during any intermediate steps. Observed frequencies (study population) Participation percentages Exposed (E=1) 150 Unexposed (E=0) Exposed (E=1) Unexposed (E=0) 150 80% 60% Cases (D=1) Controls (D=0) 150 150 60% 40% Observed odds ratio Expected true Frequencies (source population) Inverse probability of participation weights Exposed (E=1) Unexposed (E=0) Exposed (E=1) Unexposed (E=0) Cases (D=1) Controls (D=0) Bias-adjusted odds ratio In the space below, interpret the observed odds ratio, interpret the bias-adjusted odds ratio, and explain how your inference may have changed based on the change from the observed odds ratio to the bias-adjusted odds ratio.