Page 1 of 1
The figure below provides steady-state operating data for a cogeneration cycle that generates electricity and provides h
Posted: Mon May 02, 2022 3:34 pm
by answerhappygod
- The Figure Below Provides Steady State Operating Data For A Cogeneration Cycle That Generates Electricity And Provides H 1 (155.39 KiB) Viewed 49 times
- The Figure Below Provides Steady State Operating Data For A Cogeneration Cycle That Generates Electricity And Provides H 2 (56.86 KiB) Viewed 49 times
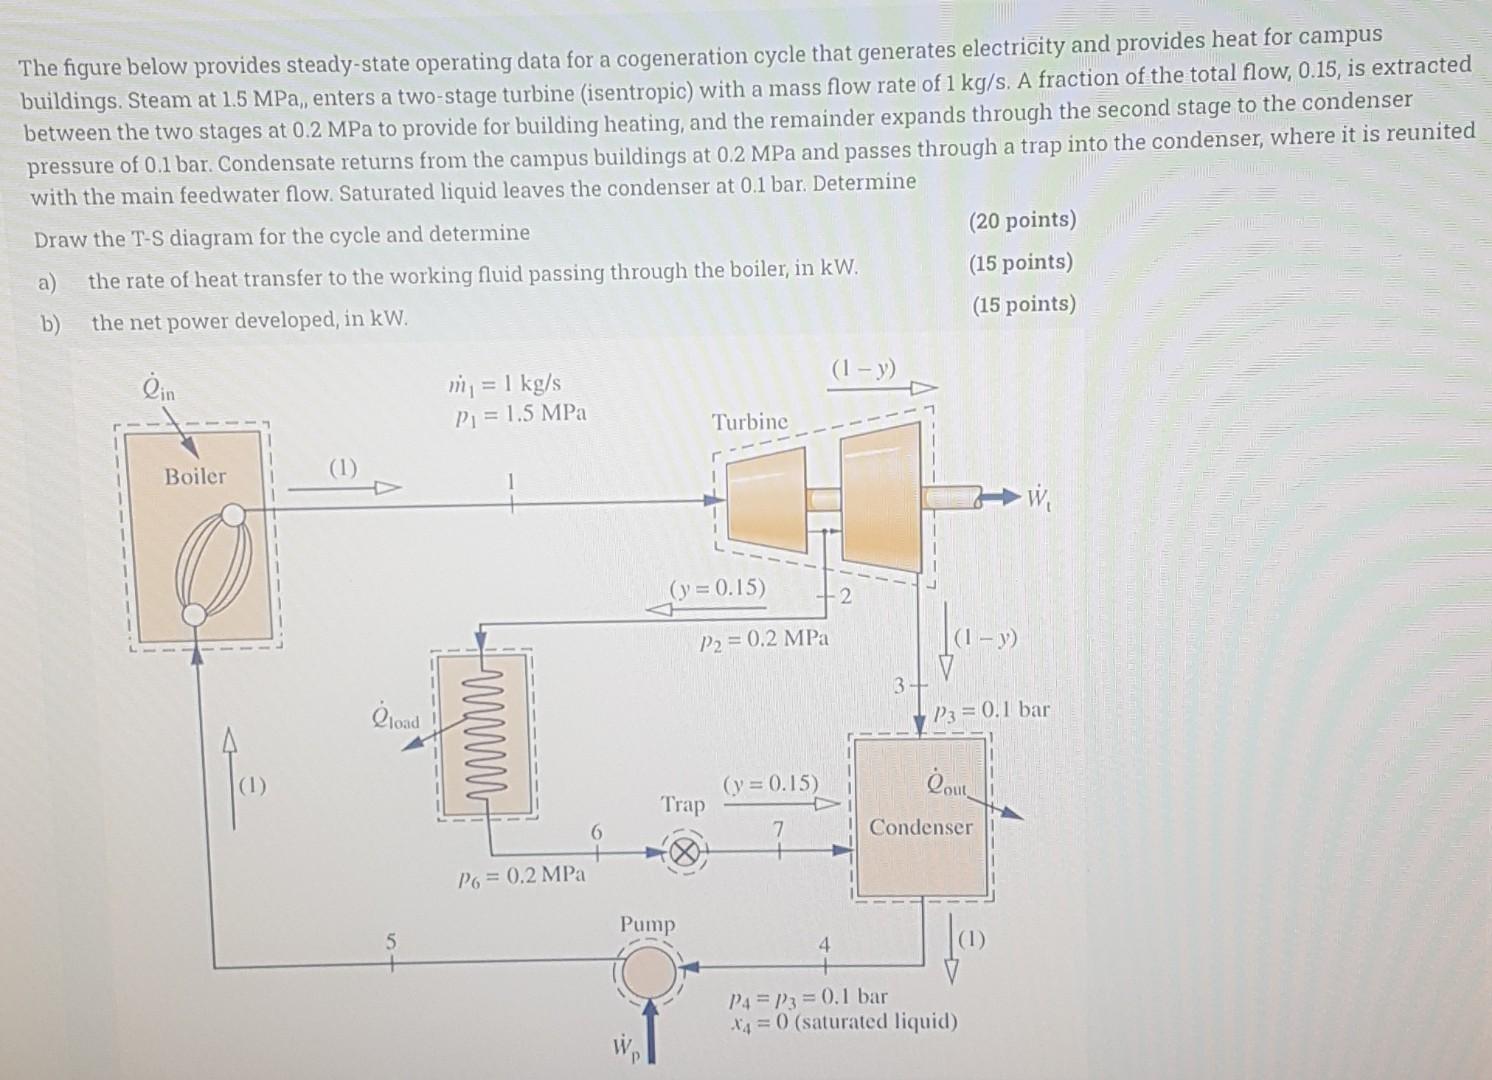
The figure below provides steady-state operating data for a cogeneration cycle that generates electricity and provides heat for campus buildings. Steam at 1.5 MPa, enters a two-stage turbine (isentropic) with a mass flow rate of 1 kg/s. A fraction of the total flow, 0.15, is extracted between the two stages at 0.2 MPa to provide for building heating, and the remainder expands through the second stage to the condenser pressure of 0.1 bar. Condensate returns from the campus buildings at 0.2 MPa and passes through a trap into the condenser, where it is reunited with the main feedwater flow. Saturated liquid leaves the condenser at 0.1 bar. Determine Draw the T-S diagram for the cycle and determine (20 points) a the rate of heat transfer to the working fluid passing through the boiler, in kW. (15 points) b) the net power developed, in kW. (15 points) (1 - y) Oin m = 1 kg/s Pi = 1.5 MPa Turbine Boiler -W (y = 0.15) P2 = 0.2 MPa fo-> y 3 Cload P3 = 0.1 bar wwwm (y = 0.15) doul Trap Condenser P = 0.2 MPa Pump 4 P4 = P3 = 0.1 bar 44 = 0 (saturated liquid)
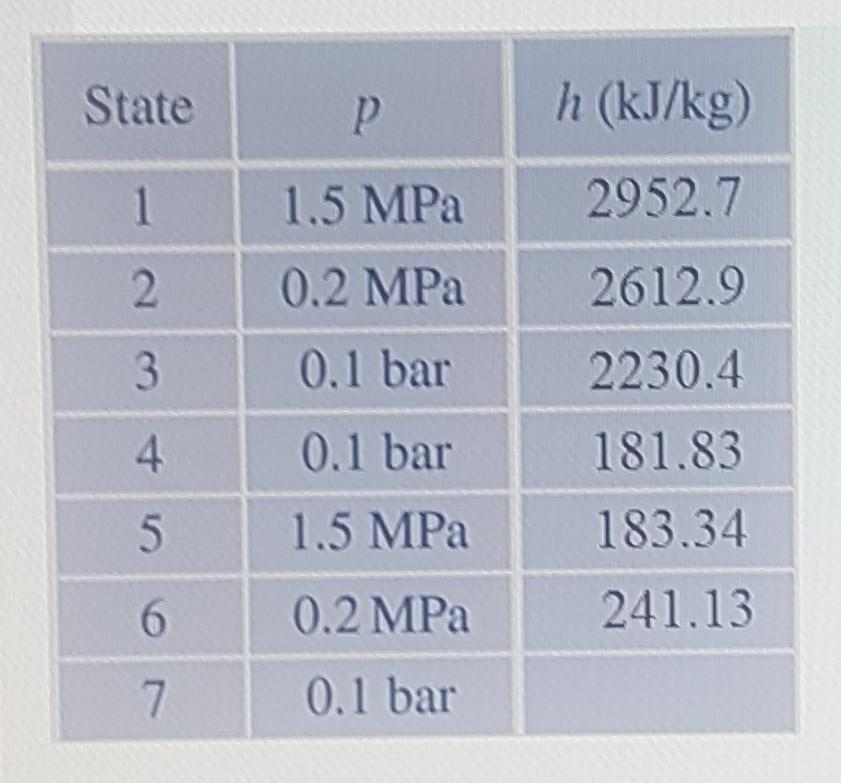
State P h (kJ/kg) 1 1.5 MPa 2952.7 2 0.2 MPa 2612.9 3 0.1 bar 2230.4 4 0.1 bar 181.83 183.34 5 1.5 MPa 6 0.2 MPa 241.13 7 0.1 bar