Page 1 of 1
Q.4 ( (20) A baseband binary signal s(t) shown below is transmitted over the AWGN channel with a power spectral density
Posted: Mon May 02, 2022 2:23 pm
by answerhappygod
- Q 4 20 A Baseband Binary Signal S T Shown Below Is Transmitted Over The Awgn Channel With A Power Spectral Density 1 (95.15 KiB) Viewed 48 times
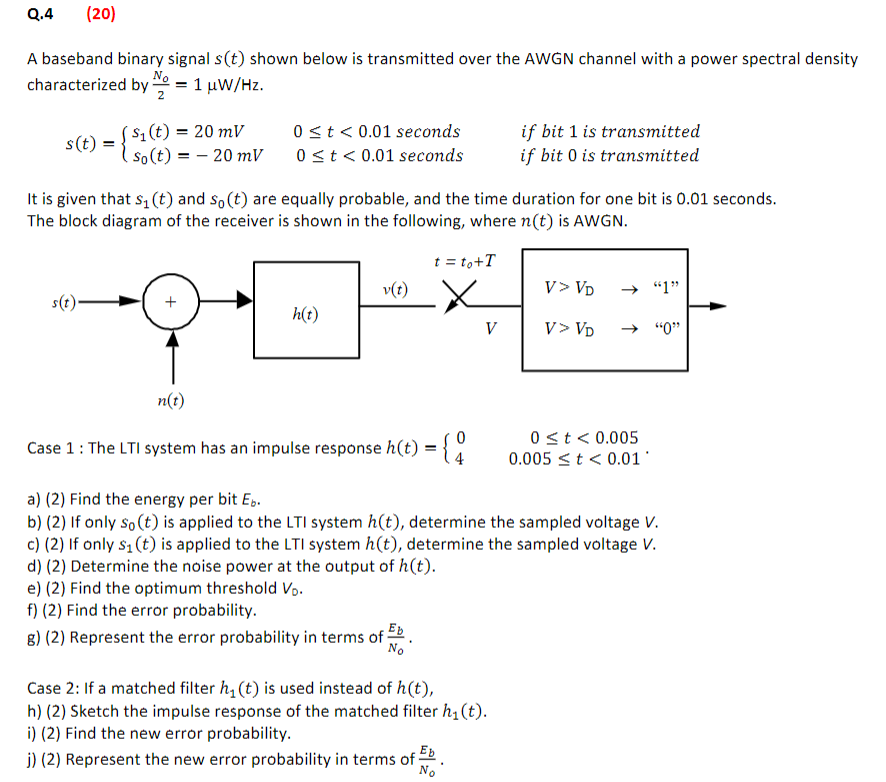
Q.4 ( (20) A baseband binary signal s(t) shown below is transmitted over the AWGN channel with a power spectral density characterized by = 1 uW/Hz. s(t) ($1(t) = 20 mV so(t) = - 20 mV ost< 0.01 seconds ost<0.01 seconds if bit 1 is transmitted if bit 0 is transmitted It is given that sı(t) and so(t) are equally probable, and the time duration for one bit is 0.01 seconds. The block diagram of the receiver is shown in the following, where n(t) is AWGN. t = to+T ve) X V> VD → "1" s(t) + h(t) V V> VD → "0" n(t) Case 1 : The LTI system has an impulse response h(t) = { = 0<t < 0.005 0.005 St<0.01 a) (2) Find the energy per bit Eb. b) (2) If only so(t) is applied to the LTI system h(t), determine the sampled voltage V. c) (2) If only su(t) is applied to the LTI system h(t), determine the sampled voltage V. d) (2) Determine the noise power at the output of h(t). e) (2) Find the optimum threshold Vo. f) (2) Find the error probability. 8) (2) Represent the error probability in terms of No Case 2: If a matched filter hı(t) is used instead of h(t), h) (2) Sketch the impulse response of the matched filter hy(t). i) (2) Find the new error probability. i) (2) Represent the new error probability in terms of No
х 1.0 1.1 1.2 1.3 1.4 1.5 1.6 1.7 1.8 1.9 2.0 2.1 Q(x) 0.159 0.136 0.115 0.097 0.081 0.067 0.055 0.045 0.036 0.029 0.023 0.018 x 2.3 2.4 2.5 2.6 2.7 2.8 3.0 3.1 3.2 3.3 2.2 Q(x) 0.014 2.9 1.9e-3 0.011 0.008 0.006 4.7e-3 3.5e-3 2.6e-3 1.4e-3 1e-3 6.9e-4 4.8e-4 NT 1e-3 = 1x10⁻³ Q(x) = for x > 3.3 X V20