Page 1 of 1
QUESTION 2 (CO3, PO1, No WP) a) Table 2 shows total rainfall for each month of the year 2012 for a 200 m2 sub- basin loc
Posted: Mon May 02, 2022 10:52 am
by answerhappygod
- Question 2 Co3 Po1 No Wp A Table 2 Shows Total Rainfall For Each Month Of The Year 2012 For A 200 M2 Sub Basin Loc 1 (87.92 KiB) Viewed 29 times
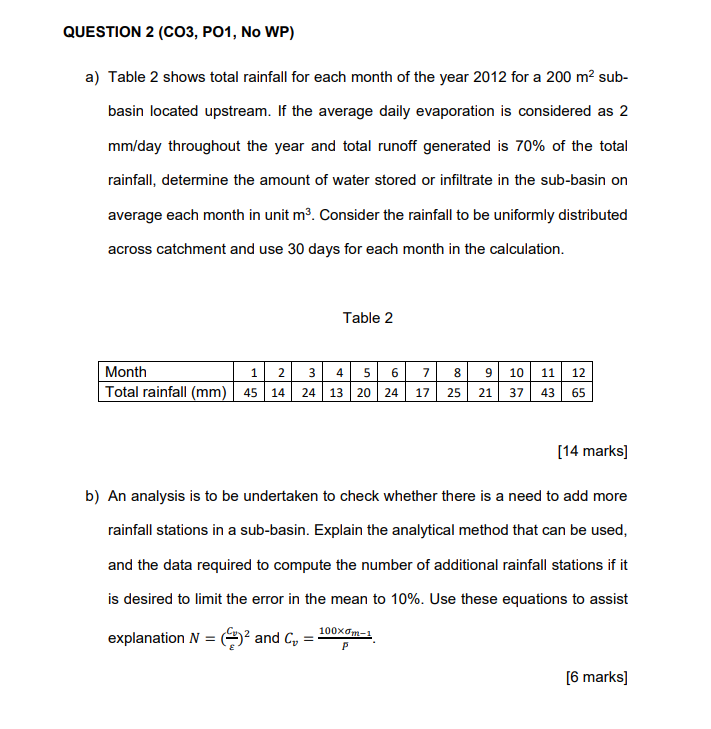
QUESTION 2 (CO3, PO1, No WP) a) Table 2 shows total rainfall for each month of the year 2012 for a 200 m2 sub- basin located upstream. If the average daily evaporation is considered as 2 mm/day throughout the year and total runoff generated is 70% of the total rainfall, determine the amount of water stored or infiltrate in the sub-basin on average each month in unit mº. Consider the rainfall to be uniformly distributed across catchment and use 30 days for each month in the calculation. Table 2 00 Month 1 2 Total rainfall (mm) 45 14 3 4 5 6 24 13 20 24 7 17 8 25 9 10 11 12 21 37 43 65 [14 marks] b) An analysis is to be undertaken to check whether there is a need to add more rainfall stations in a sub-basin. Explain the analytical method that can be used, and the data required to compute the number of additional rainfall stations if it is desired to limit the error in the mean to 10%. Use these equations to assist explanation N = 2)2 and C=- 100xom- = P [6 marks]