Page 1 of 1
2. A study area consists of three zones (1, 2, and 3). The current number of trips between the zones is shown in Table 4
Posted: Mon May 02, 2022 10:45 am
by answerhappygod
- 2 A Study Area Consists Of Three Zones 1 2 And 3 The Current Number Of Trips Between The Zones Is Shown In Table 4 1 (36.62 KiB) Viewed 41 times

- 2 A Study Area Consists Of Three Zones 1 2 And 3 The Current Number Of Trips Between The Zones Is Shown In Table 4 2 (36.62 KiB) Viewed 41 times
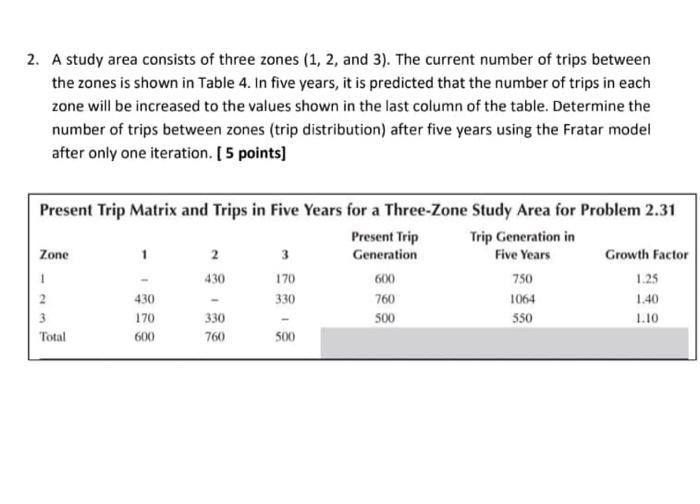
2. A study area consists of three zones (1, 2, and 3). The current number of trips between the zones is shown in Table 4. In five years, it is predicted that the number of trips in each zone will be increased to the values shown in the last column of the table. Determine the number of trips between zones (trip distribution) after five years using the Fratar model after only one iteration. [ 5 points] Present Trip Matrix and Trips in Five Years for a Three-Zone Study Area for Problem 2.31 Present Trip Trip Generation in Zone 1 2 3 Generation Five Years Growth Factor 1 170 1.25 2 330 760 1064 1.40 3 170 330 500 1.10 Total 600 760 500 430 600 750 430 550