Page 1 of 1
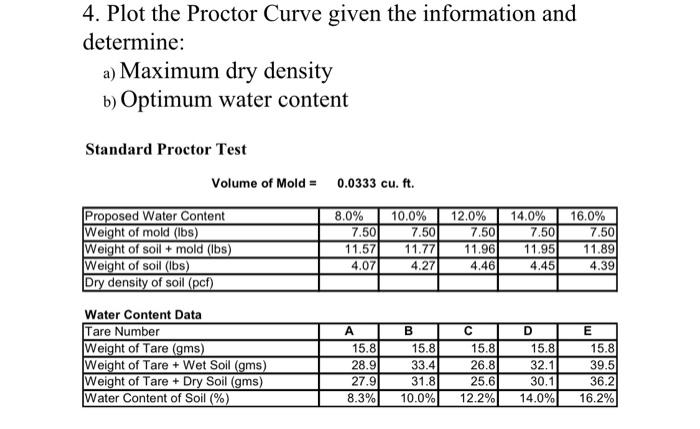
4. Plot the Proctor Curve given the information and determine: a) Maximum dry density b) Optimum water content Standard
Posted: Mon May 02, 2022 10:27 am
by answerhappygod
- 4 Plot The Proctor Curve Given The Information And Determine A Maximum Dry Density B Optimum Water Content Standard 1 (46.73 KiB) Viewed 34 times
4. Plot the Proctor Curve given the information and determine: a) Maximum dry density b) Optimum water content Standard Proctor Test Volume of Mold = 0.0333 cu. ft. Proposed Water Content Weight of mold (lbs) Weight of soil + mold (lbs) Weight of soil (lbs) Dry density of soil (pcf) 8.0% 7.50 11.57 4.07 10.0% 7.50 11.77 4.27 12.0% 14.0% 7.50 7.50 11.96 11.95 4.46 4.45 16.0% 7.50 11.89 4.39 Water Content Data Tare Number Weight of Tare (gms) Weight of Tare + Wet Soil (gms) Weight of Tare + Dry Soil (gms) Water Content of Soil (%) A 15.8 28.9 27.9 8.3% B 15.8 33.4 31.8 10.0% C 15.8 26.8 25.6 12.2% D 15.8 32.1 30.1 14.0% E 15.8 39.5 36.2 16.2%