Page 1 of 1
The figure below shows the proposed layout and design peak hour flows for the intersection of a major road with a minor
Posted: Mon May 02, 2022 10:17 am
by answerhappygod
- The Figure Below Shows The Proposed Layout And Design Peak Hour Flows For The Intersection Of A Major Road With A Minor 1 (68.82 KiB) Viewed 35 times
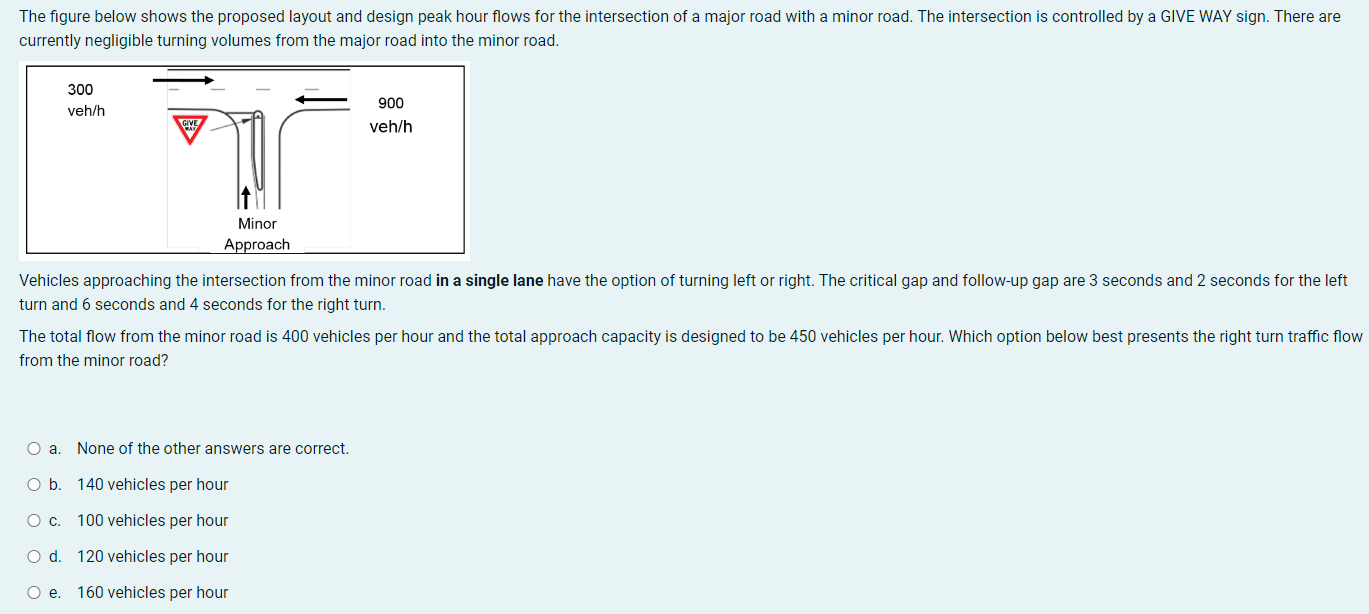
The figure below shows the proposed layout and design peak hour flows for the intersection of a major road with a minor road. The intersection is controlled by a GIVE WAY sign. There are currently negligible turning volumes from the major road into the minor road. 300 veh/h 900 veh/h Minor Approach Vehicles approaching the intersection from the minor road in a single lane have the option of turning left or right. The critical gap and follow-up gap are 3 seconds and 2 seconds for the left turn and 6 seconds and 4 seconds for the right turn. The total flow from the minor road is 400 vehicles per hour and the total approach capacity is designed to be 450 vehicles per hour. Which option below best presents the right turn traffic flow from the minor road? O a. None of the other answers are correct. Ob. 140 vehicles per hour ос. 100 vehicles per hour Od 120 vehicles per hour Oe 160 vehicles per hour