Page 1 of 1
F G H K L M N O Р 0 R S T U Dates Portfolio alpha 1 bench mark alpha 0.85% 2.20% -2.01% 1.77% 1.69% -2.63% 2 3 Portfolio
Posted: Mon May 02, 2022 9:40 am
by answerhappygod
- 1 (90.76 KiB) Viewed 39 times
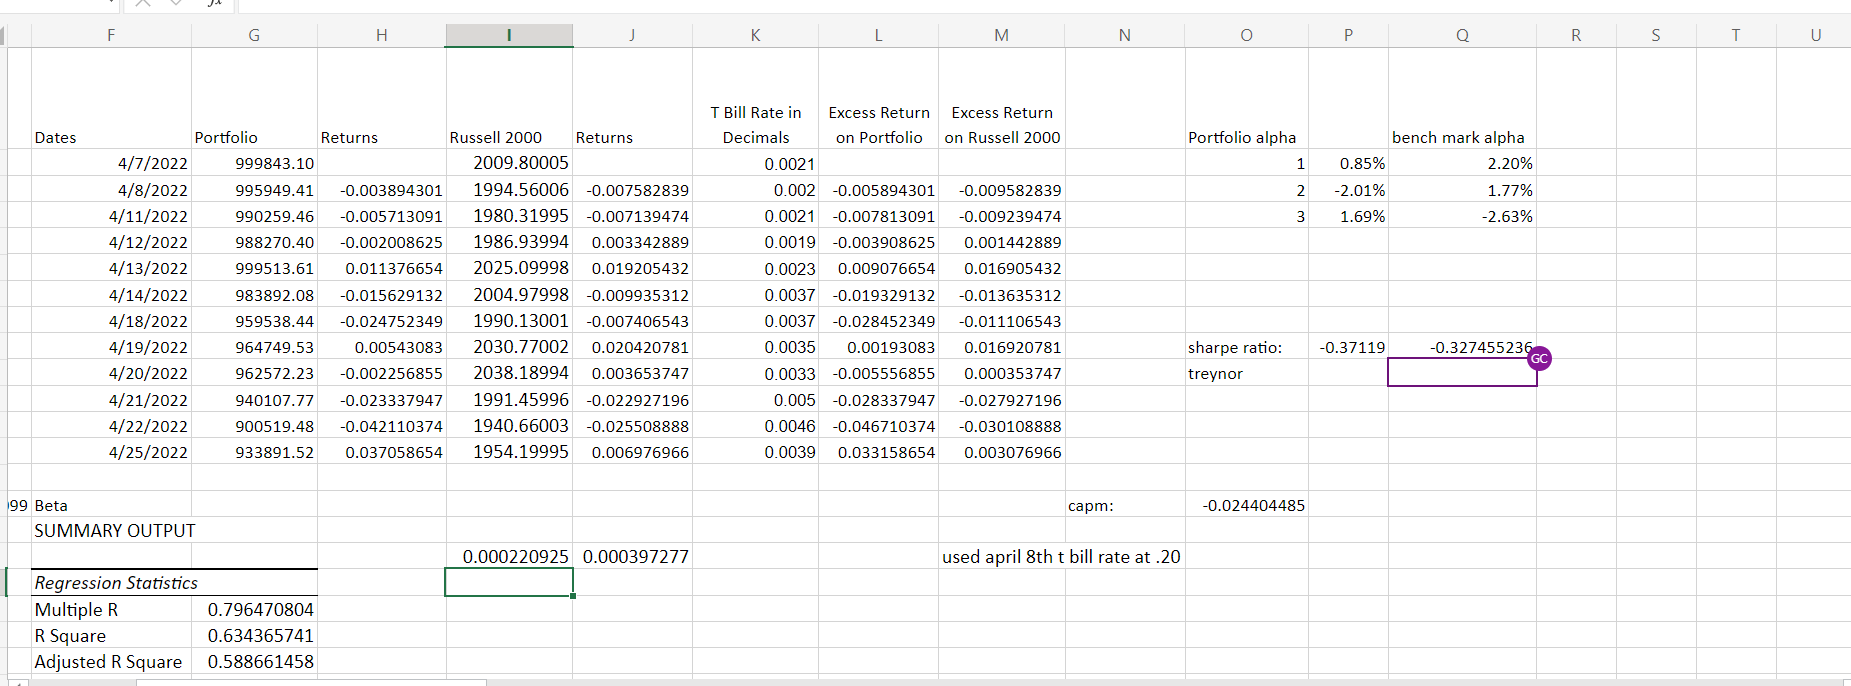
F G H K L M N O Р 0 R S T U Dates Portfolio alpha 1 bench mark alpha 0.85% 2.20% -2.01% 1.77% 1.69% -2.63% 2 3 Portfolio Returns Russell 2000 Returns 4/7/2022 999843.10 2009.80005 4/8/2022 995949.41 -0.003894301 1994.56006 -0.007582839 4/11/2022 990259.46 -0.005713091 1980.31995 -0.007139474 4/12/2022 988270.40 -0.002008625 1986.93994 0.003342889 4/13/2022 999513.61 0.011376654 2025.09998 0.019205432 4/14/2022 983892.08 -0.015629132 2004.97998 -0.009935312 4/18/2022 959538.44 -0.024752349 1990.13001 -0.007406543 4/19/2022 964749.53 0.00543083 2030.77002 0.020420781 4/20/2022 962572.23 -0.002256855 2038.18994 0.003653747 4/21/2022 940107.77 -0.023337947 1991.45996 -0.022927196 4/22/2022 900519.48 -0.042110374 1940.66003 -0.025508888 4/25/2022 933891.52 0.037058654 1954.19995 0.006976966 T Bill Rate in Excess Return Excess Return Decimals on Portfolio on Russell 2000 0.0021 0.002 -0.005894301 -0.009582839 0.0021 -0.007813091 -0.009239474 0.0019 -0.003908625 0.001442889 0.0023 0.009076654 0.016905432 0.0037 -0.019329132 -0.013635312 0.0037 -0.028452349 -0.011106543 0.0035 0.00193083 0.016920781 0.0033 -0.005556855 0.000353747 0.005 -0.028337947 -0.027927196 0.0046 -0.046710374 -0.030108888 0.0039 0.033158654 0.003076966 -0.37119 sharpe ratio: treynor -0.327455236 GC capm: -0.024404485 99 Beta SUMMARY OUTPUT 0.000220925 0.000397277 used april 8th t bill rate at.20 Regression Statistics Multiple R R Square Adjusted R Square 0.796470804 0.634365741 0.588661458