- Relevant Cash Flows No Terminal Value Central Laundry And Cleaners Is Considering Replacing An Existing Piece Of Machine 1 (88.33 KiB) Viewed 69 times
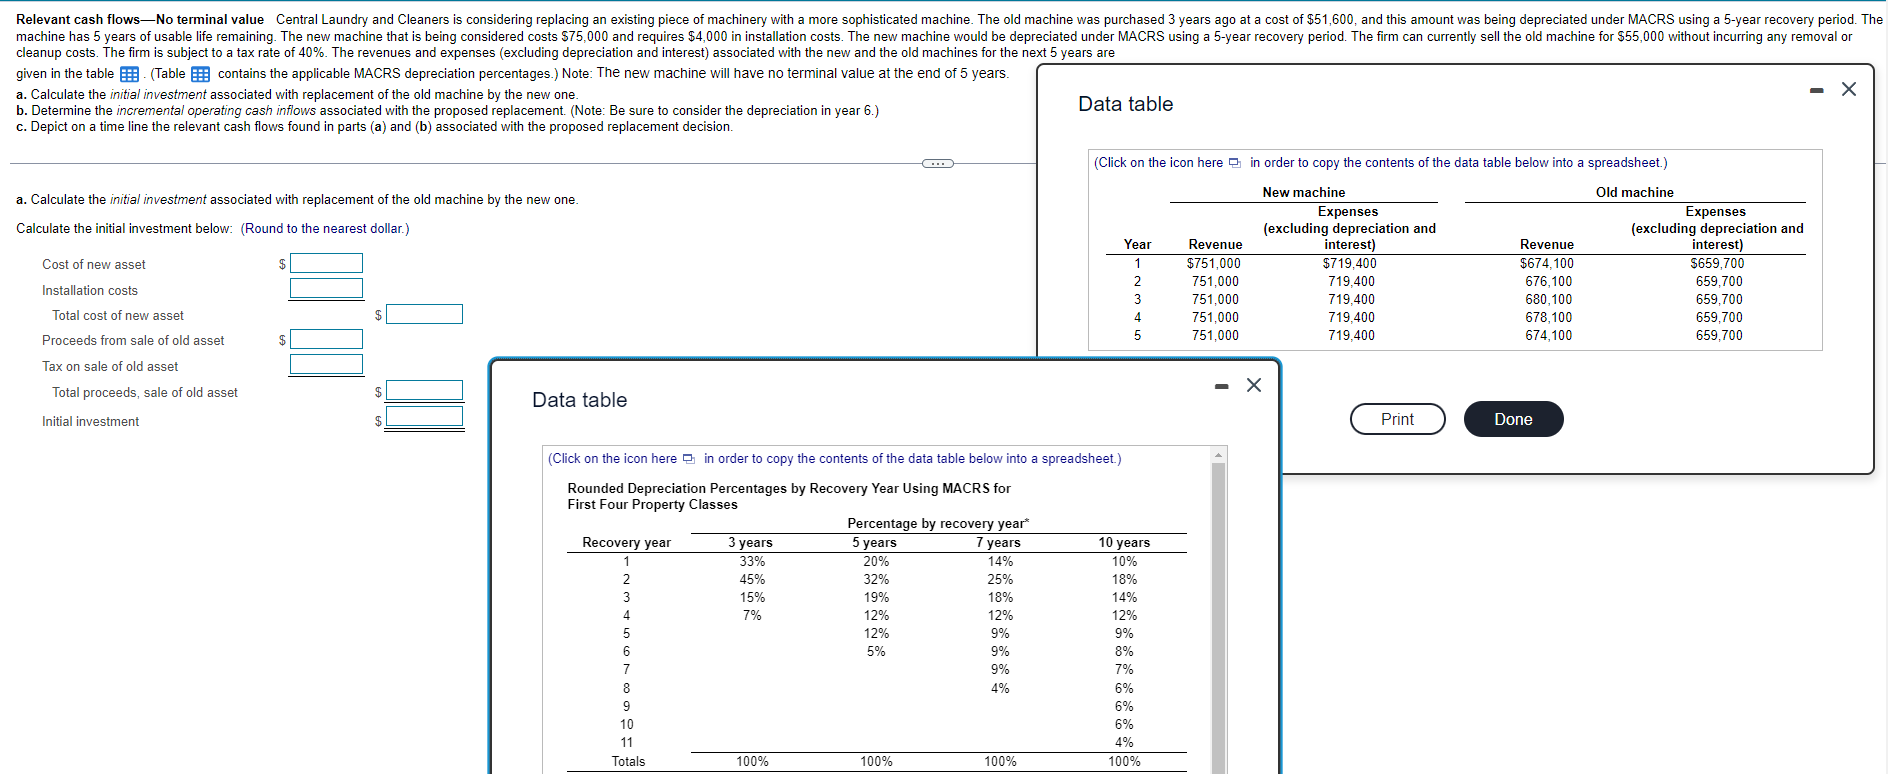
Relevant cash flows—No terminal value Central Laundry and Cleaners is considering replacing an existing piece of machinery with a more sophisticated machine. The old machine was purchased 3 years ago at a cost of $51,600, and this amount was being depreciated under MACRS using a 5-year recovery period. The machine has 5 years of usable life remaining. The new machine that is being considered costs $75,000 and requires $4,000 in installation costs. The new machine would be depreciated under MACRS using a 5-year recovery period. The firm can currently sell the old machine for $55,000 without incurring any removal or cleanup costs. The firm is subject to a tax rate of 40%. The revenues and expenses (excluding depreciation and interest) associated with the new and the old machines for the next 5 years are given in the table B (Table B contains the applicable MACRS depreciation percentages.) Note: The new machine will have no terminal value at the end of 5 years. a. Calculate the initial investment associated with replacement of the old machine by the new one. b. Determine the incremental operating cash inflows associated with the proposed replacement. (Note: Be sure to consider the depreciation in year 6.) Data table c. Depict on a time line the relevant cash flows found in parts (a) and (b) associated with the proposed replacement decision. . (Click on the icon here in order to copy the contents of the data table below into a spreadsheet.) a. Calculate the initial investment associated with replacement of the old machine by the new one. Calculate the initial investment below: (Round to the nearest dollar.) Cost of new asset Year 1 2 3 4 5 New machine Expenses (excluding depreciation and interest) $719,400 719,400 719.400 719,400 719,400 Revenue $751,000 751,000 751,000 751.000 751,000 Installation costs Old machine Expenses (excluding depreciation and interest) $659,700 659,700 659,700 659,700 659.700 Revenue $674.100 676,100 680,100 678,100 674,100 Total cost of new asset $ Proceeds from sale of old asset Tax on sale of old asset Total proceeds, sale of old asset - X Data table Initial investment Print Done (Click on the icon here e in order to copy the contents of the data table below into a spreadsheet.) Rounded Depreciation Percentages by Recovery Year Using MACRS for First Four Property Classes Percentage by recovery year* Recovery year 3 years 5 years 7 years 10 years 33% 20% 14% 10% 2 45% 32% 25% 18% 3 15% 19% 18% 14% 4 7% 12% 12% 12% 5 12% 9% 9% 6 5% 9% 8% 7 9% 7% 8 4% 6% 9 6% 10 6% 11 4% Totals 100% 100% 100% 100%