Page 1 of 1
Consider the following scenario: 1 2 E(r) 3 B 10.125 9.125 с 8.125 5 10 15 17 20 o The expected returns of P, A, B and C
Posted: Mon May 02, 2022 9:17 am
by answerhappygod
- 1 (79.74 KiB) Viewed 22 times
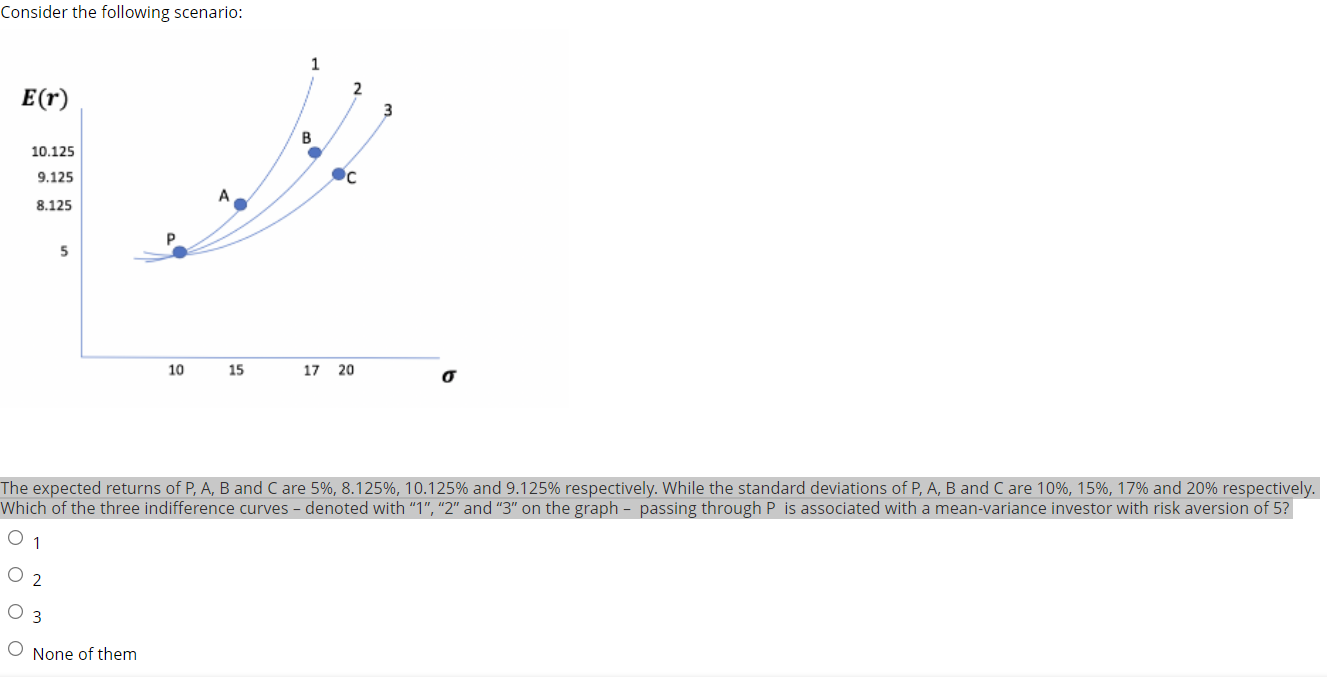
Consider the following scenario: 1 2 E(r) 3 B 10.125 9.125 с 8.125 5 10 15 17 20 o The expected returns of P, A, B and Care 5%, 8.125%, 10.125% and 9.125% respectively. While the standard deviations of P, A, B and Care 10%, 15%, 17% and 20% respectively. Which of the three indifference curves - denoted with "1","2" and "3" on the graph - passing through P is associated with a mean-variance investor with risk aversion of 5? O 1 O2 3 O None of them