Page 1 of 1
2. The following table shows the 90 Day Bank Bill trades for a person in the Capital Markets. Bank Bills Date Rate Open
Posted: Mon May 02, 2022 9:00 am
by answerhappygod
- 2 The Following Table Shows The 90 Day Bank Bill Trades For A Person In The Capital Markets Bank Bills Date Rate Open 1 (83.23 KiB) Viewed 29 times
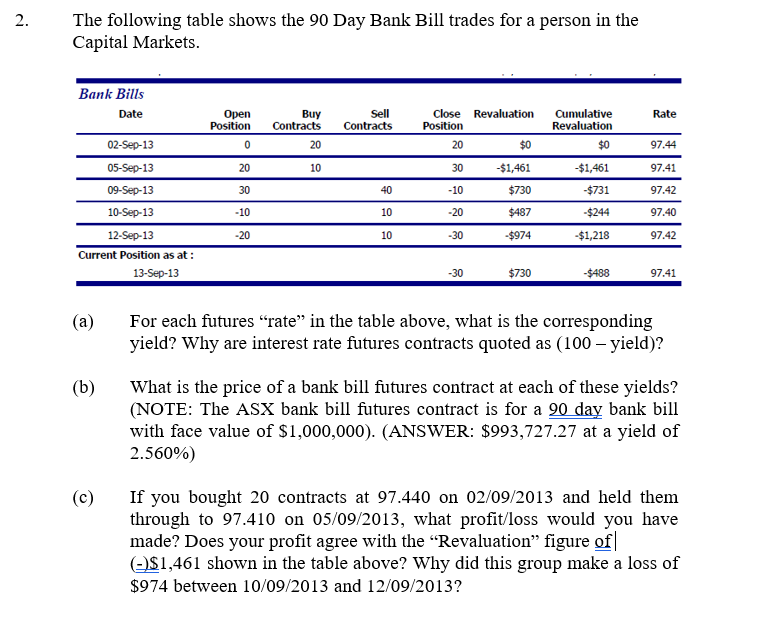
2. The following table shows the 90 Day Bank Bill trades for a person in the Capital Markets. Bank Bills Date Rate Open Position Buy Contracts Sell Contracts Close Revaluation Position 20 $0 Cumulative Revaluation $0 0 20 97.44 20 10 30 -$1,461 -$1,461 97.41 30 40 -10 $730 -$731 97.42 02-Sep-13 05-Sep-13 09-Sep-13 10-Sep-13 12-Sep-13 Current Position as at: 13-Sep-13 -10 10 -20 $487 -$244 97.40 -20 10 -30 -$974 -$1,218 97.42 -30 $730 -$488 97.41 (a) For each futures “rate” in the table above, what is the corresponding yield? Why are interest rate futures contracts quoted as (100 - yield)? (b) What is the price of a bank bill futures contract at each of these yields? (NOTE: The ASX bank bill futures contract is for a 90 day bank bill with face value of $1,000,000). (ANSWER: $993,727.27 at a yield of 2.560%) (C) If you bought 20 contracts at 97.440 on 02/09/2013 and held them through to 97.410 on 05/09/2013, what profit/loss would you have made? Does your profit agree with the “Revaluation” figure of -$1,461 shown in the table above? Why did this group make a loss of $974 between 10/09/2013 and 12/09/2013?