Page 1 of 1
Question 1 The table below includes data on the market demand for an antihistamine drug as well as data on the total cos
Posted: Mon May 02, 2022 8:38 am
by answerhappygod
- Question 1 The Table Below Includes Data On The Market Demand For An Antihistamine Drug As Well As Data On The Total Cos 1 (178.81 KiB) Viewed 20 times
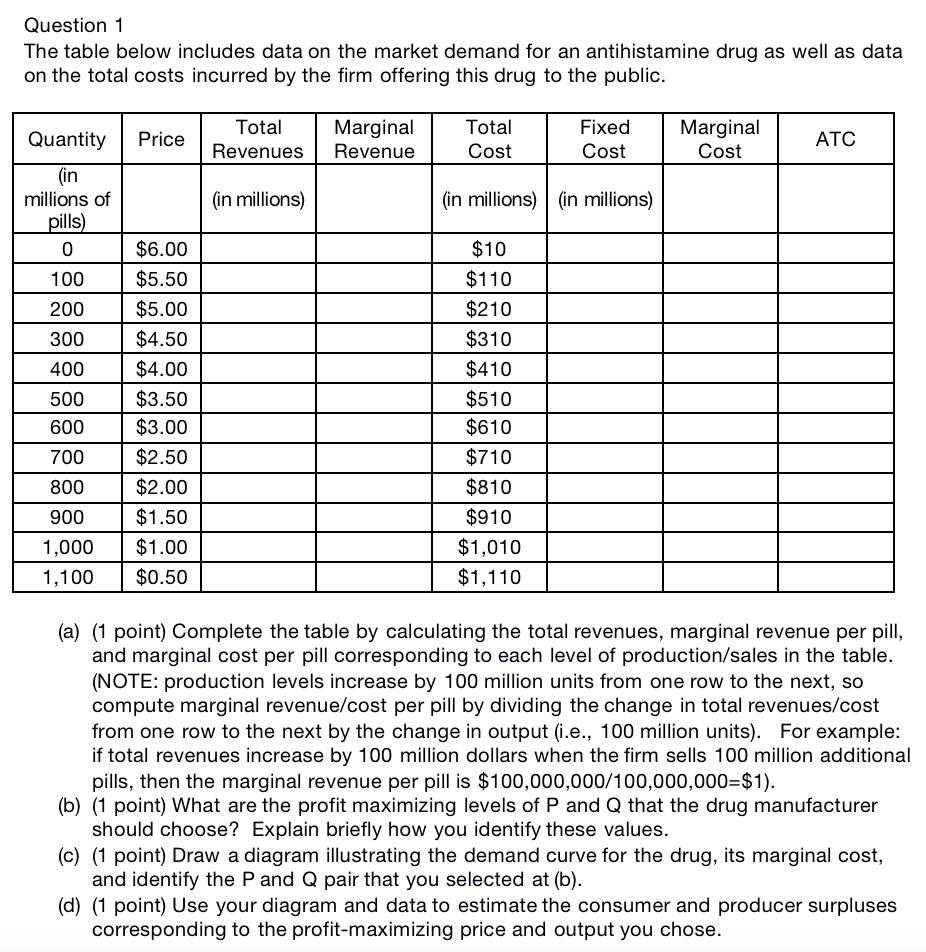
Question 1 The table below includes data on the market demand for an antihistamine drug as well as data on the total costs incurred by the firm offering this drug to the public. Quantity Price Total Revenues Marginal Revenue Total Cost Fixed Cost Marginal Cost ATC (in millions) (in millions) (in millions) (in millions of pills) 0 $10 $110 100 200 $210 300 400 500 600 700 $6.00 $5.50 $5.00 $4.50 $4.00 $3.50 $3.00 $2.50 $2.00 $1.50 $1.00 $0.50 $310 $410 $510 $610 $710 $810 $910 $1,010 $1,110 800 900 1,000 1,100 (a) (1 point) Complete the table by calculating the total revenues, marginal revenue per pill, and marginal cost per pill corresponding to each level of production/sales in the table. (NOTE: production levels increase by 100 million units from one row to the next, so compute marginal revenue/cost per pill by dividing the change in total revenues/cost from one row to the next by the change in output (i.e., 100 million units). For example: if total revenues increase by 100 million dollars when the firm sells 100 million additional pills, then the marginal revenue per pill is $100,000,000/100,000,000=$1). (b) (1 point) What are the profit maximizing levels of P and Q that the drug manufacturer should choose? Explain briefly how you identify these values. (c) (1 point) Draw a diagram illustrating the demand curve for the drug, its marginal cost, and identify the P and Q pair that you selected at (b). (d) (1 point) Use your diagram and data to estimate the consumer and producer surpluses corresponding to the profit-maximizing price and output you chose.