Page 1 of 1
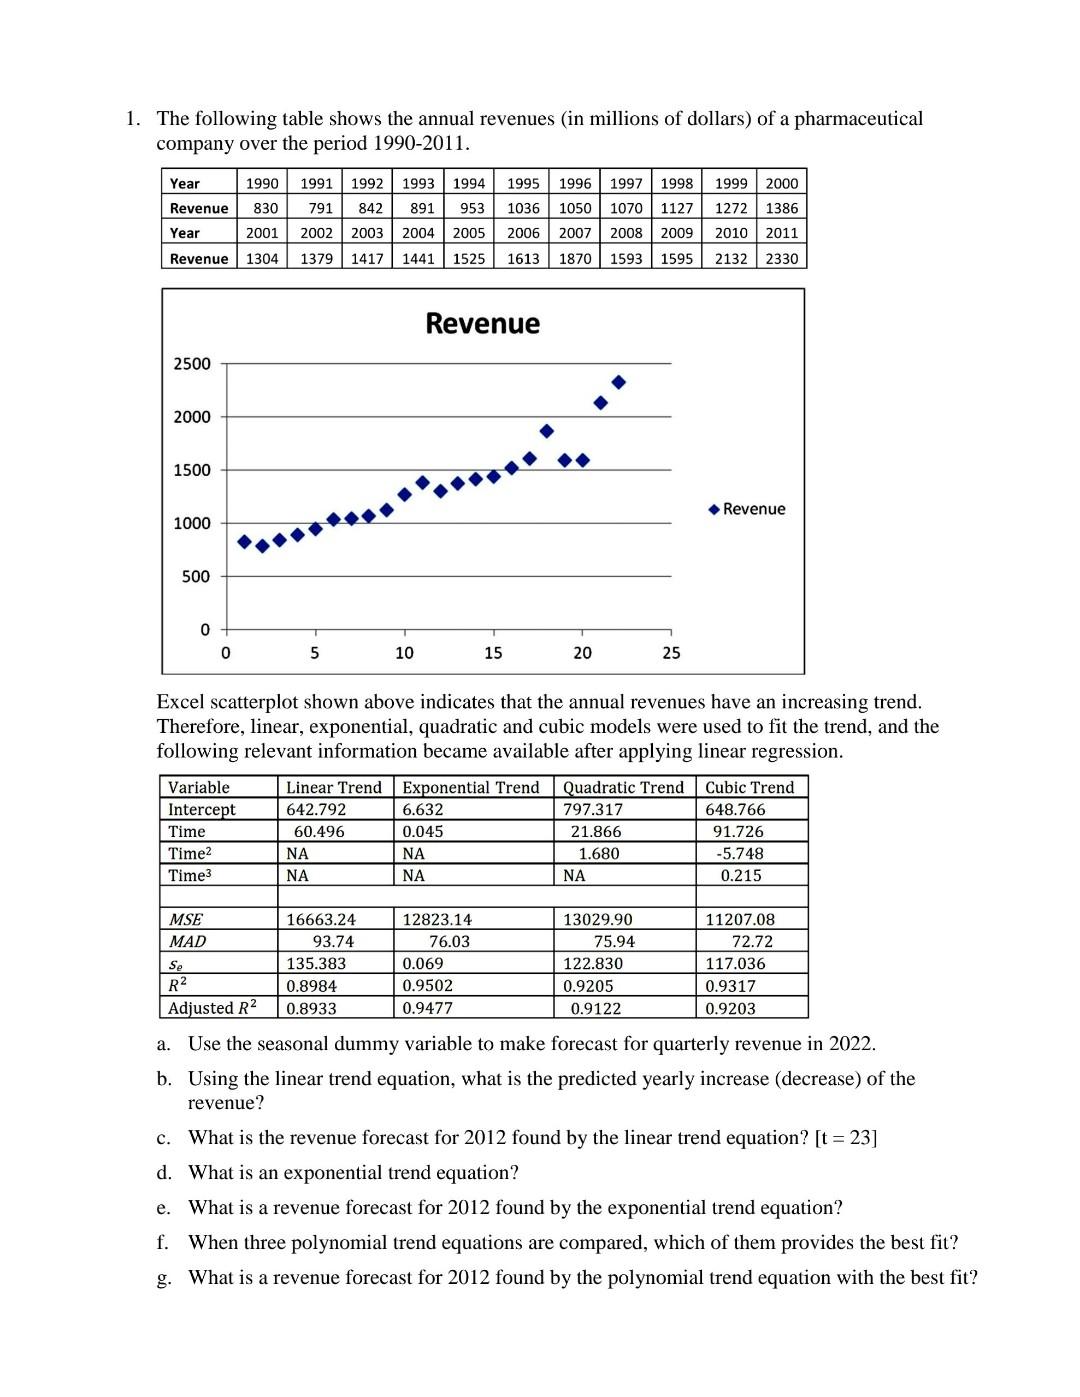
1. The following table shows the annual revenues (in millions of dollars) of a pharmaceutical company over the period 19
Posted: Mon May 02, 2022 7:16 am
by answerhappygod
- 1 The Following Table Shows The Annual Revenues In Millions Of Dollars Of A Pharmaceutical Company Over The Period 19 1 (177.5 KiB) Viewed 55 times
- 1 The Following Table Shows The Annual Revenues In Millions Of Dollars Of A Pharmaceutical Company Over The Period 19 2 (49.45 KiB) Viewed 55 times
1. The following table shows the annual revenues (in millions of dollars) of a pharmaceutical company over the period 1990-2011. 1990 1991 1992 1993 1994 1995 1996 1999 2000 Year Revenue 830 791 842 953 1036 1050 1997 1998 1070 1127 2008 2009 1386 891 2004 2005 1272 2010 Year 2001 2002 2003 2006 2007 2011 Revenue 1304 1379 1417 1441 1525 1613 1870 1593 1595 2132 2330 Revenue 2500 2000 1500 Revenue 1000 500 0 0 5 10 15 20 25 Excel scatterplot shown above indicates that the annual revenues have an increasing trend. Therefore, linear, exponential, quadratic and cubic models were used to fit the trend, and the following relevant information became available after applying linear regression. Variable Linear Trend Exponential Trend Quadratic Trend Cubic Trend Intercept 642.792 6.632 797.317 648.766 Time 60.496 0.045 21.866 91.726 Time2 NA NA 1.680 -5.748 Time3 NA NA NA 0.215 MSE MAD Se R2 Adjusted R2 16663.24 93.74 135.383 0.8984 0.8933 12823.14 76.03 0.069 0.9502 0.9477 13029.90 75.94 122.830 0.9205 0.9122 11207.08 72.72 117.036 0.9317 0.9203 a. Use the seasonal dummy variable to make forecast for quarterly revenue in 2022. b. Using the linear trend equation, what is the predicted yearly increase (decrease) of the revenue? c. What is the revenue forecast for 2012 found by the linear trend equation? [t = 23] d. What is an exponential trend equation? e. What is a revenue forecast for 2012 found by the exponential trend equation? f. When three polynomial trend equations are compared, which of them provides the best fit? g. What is a revenue forecast for 2012 found by the polynomial trend equation with the best fit?
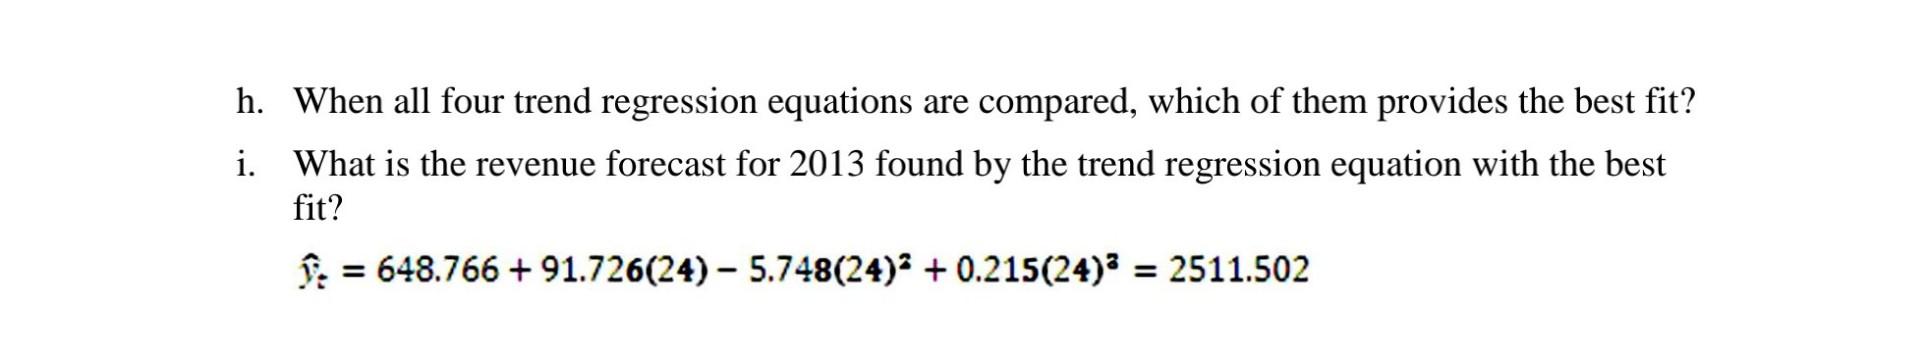
h. When all four trend regression equations are compared, which of them provides the best fit? i. What is the revenue forecast for 2013 found by the trend regression equation with the best fit? = 648.766 + 91.726(24)- 5.748(24)* + 0.215(24)3 = 2511.502 =