Page 1 of 1
1. The followings are the cumulative operating income graph used in Customer Profitability Analysis. Which one would be
Posted: Mon May 02, 2022 6:56 am
by answerhappygod
- 1 The Followings Are The Cumulative Operating Income Graph Used In Customer Profitability Analysis Which One Would Be 1 (122.8 KiB) Viewed 43 times
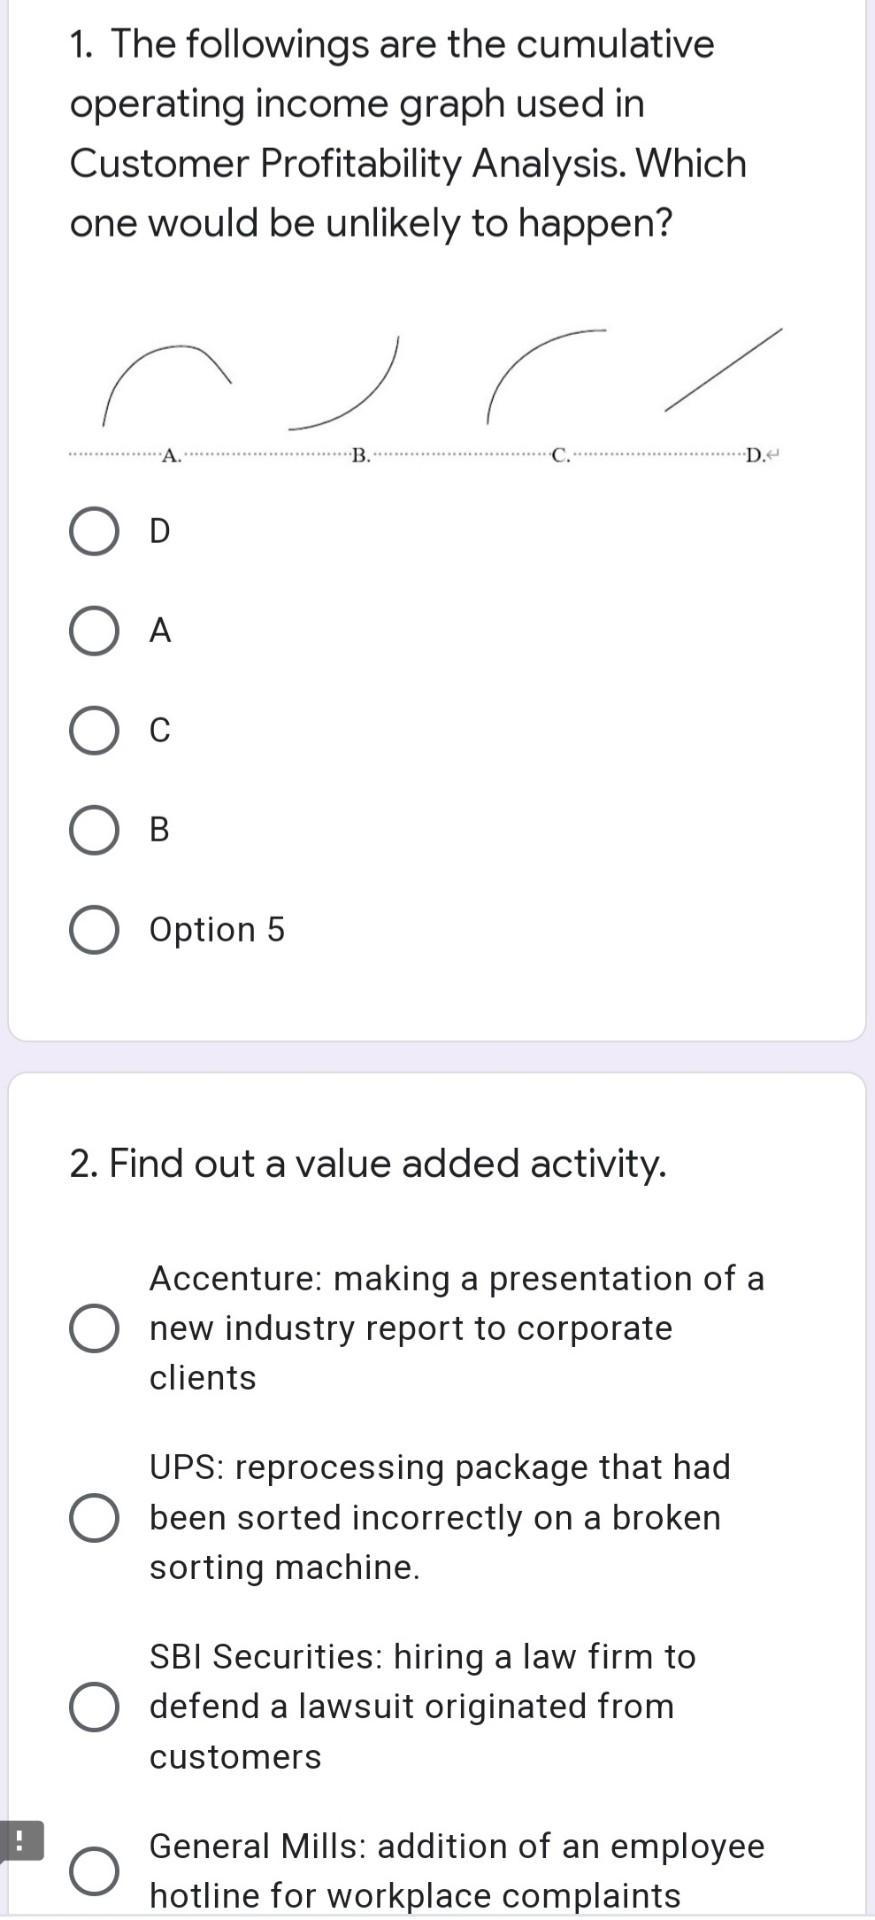
1. The followings are the cumulative operating income graph used in Customer Profitability Analysis. Which one would be unlikely to happen? В. D D А. С B Option 5 2. Find out a value added activity. Accenture: making a presentation of a new industry report to corporate clients UPS: reprocessing package that had been sorted incorrectly on a broken sorting machine. SBI Securities: hiring a law firm to defend a lawsuit originated from customers General Mills: addition of an employee hotline for workplace complaints