Page 1 of 1
Question B.1 (1 point) For each of the target metals, work with the intensity and color to get graphs of the Electron En
Posted: Fri Apr 29, 2022 12:10 pm
by answerhappygod
- Question B 1 1 Point For Each Of The Target Metals Work With The Intensity And Color To Get Graphs Of The Electron En 1 (29.84 KiB) Viewed 23 times
answer:
- Question B 1 1 Point For Each Of The Target Metals Work With The Intensity And Color To Get Graphs Of The Electron En 2 (16.93 KiB) Viewed 23 times
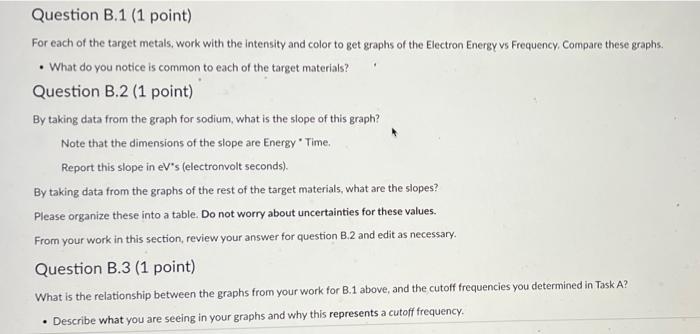
Question B.1 (1 point) For each of the target metals, work with the intensity and color to get graphs of the Electron Energy vs Frequency. Compare these graphs. . What do you notice is common to each of the target materials? Question B.2 (1 point) By taking data from the graph for sodium, what is the slope of this graph? Note that the dimensions of the slope are Energy Time Report this slope in eV's (electronvolt seconds) By taking data from the graphs of the rest of the target materials, what are the slopes? Please organize these into a table. Do not worry about uncertainties for these values. From your work in this section, review your answer for question B.2 and edit as necessary. Question B.3 (1 point) What is the relationship between the graphs from your work for B.1 above, and the cutoff frequencies you determined in Task A? • Describe what you are seeing in your graphs and why this represents a cutoff frequency a
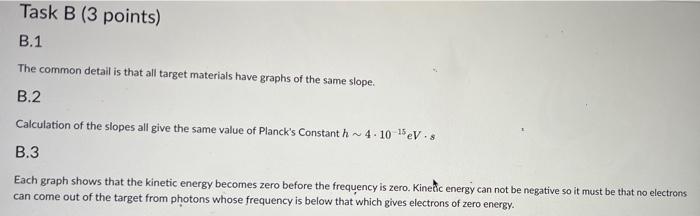
Task B (3 points) B.1 The common detail is that all target materials have graphs of the same slope. B.2 Calculation of the slopes all give the same value of Planck's Constant h ~ 4.10 1eV. B.3 Each graph shows that the kinetic energy becomes zero before the frequency is zero. Kinetic energy can not be negative so it must be that no electrons can come out of the target from photons whose frequency is below that which gives electrons of zero energy.