Page 1 of 1
Question 7: Plotting a Logarithmic Plot. In(A) Corrected (blue) and In(A) Uncorrected (red) . 1 2 30 The blue line has b
Posted: Fri Apr 29, 2022 12:03 pm
by answerhappygod
- Question 7 Plotting A Logarithmic Plot In A Corrected Blue And In A Uncorrected Red 1 2 30 The Blue Line Has B 1 (55.28 KiB) Viewed 41 times
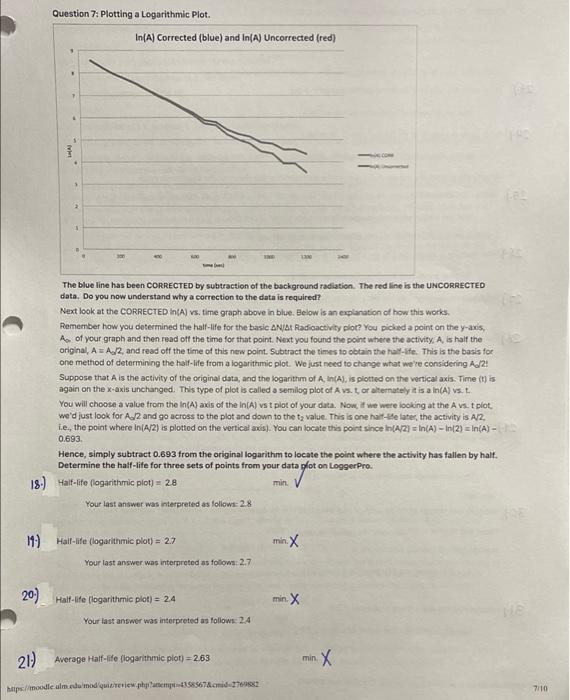
Question 7: Plotting a Logarithmic Plot. In(A) Corrected (blue) and In(A) Uncorrected (red) . 1 2 30 The blue line has been CORRECTED by subtraction of the background radiation. The red line is the UNCORRECTED data. Do you now understand why a correction to the data is required? Next look at the CORRECTED In(A) vs. time graph above in blue. Below is an explanation of how this works Remember how you determined the half-life for the basic AN/A Radioactivity plot? You picada point on the y-axis, A of your graph and then read off the time for that point. Next you found the point where the activity. A is half the original, AA,/2, and read off the time of this new point. Subtract the times to obtain the halfe. This is the basis for one method of determining the half-life from a logarithmic plot. We just need to change what we're considering A./2. Suppose that A is the activity of the original data, and the logarithm of A, In(A), is piotted on the vertical axis. Time (t) is again on the x-axis unchanged. This type of plot is called a semilog plot of A vs. t, or alternately it is a In vs. L. You will choose a value from the In(A) axis of the In(A) vs t plot of your data. Now, it we were looking at the Avst plot. we'd just look for A./2 and go across to the plot and down to the tzvalue. This is one hatte later, the activity is A/2. i.e, the point where in(A2) is plotted on the vertical axis). You can locate this point since In (A/2) = n(A) - In/2) = In{A) - 0.693 Hence, simply subtract 0.693 from the original logarithm to locate the point where the activity has fallen by halt. Determine the half-life for three sets of points from your data plot on LoggerPro. Half-life llogarithmic plot) = 28 = min Your last answer was interpreted as follows: 2.8 18.) 11) Half-life (logarithmic plot) = 2.7 min X Your last answer was interpreted as follows: 2.7 20) Halt-ute (logarithmic plot) = 24 min. X Your last answer was interpreted as follows: 2.4 21) Average Half-life (logarithmic plot) = 253 min Х
https://moodle umedu modiquitreiew.plump6567&cd703 7110