Urgent Pls. please Read all part and answer
with care and pls don't cut and paste previous answers answers as
there are issues. hope you understand.
- Urgent Pls Please Read All Part And Answer With Care And Pls Don T Cut And Paste Previous Chegg Answers As There Are Is 1 (223 KiB) Viewed 34 times
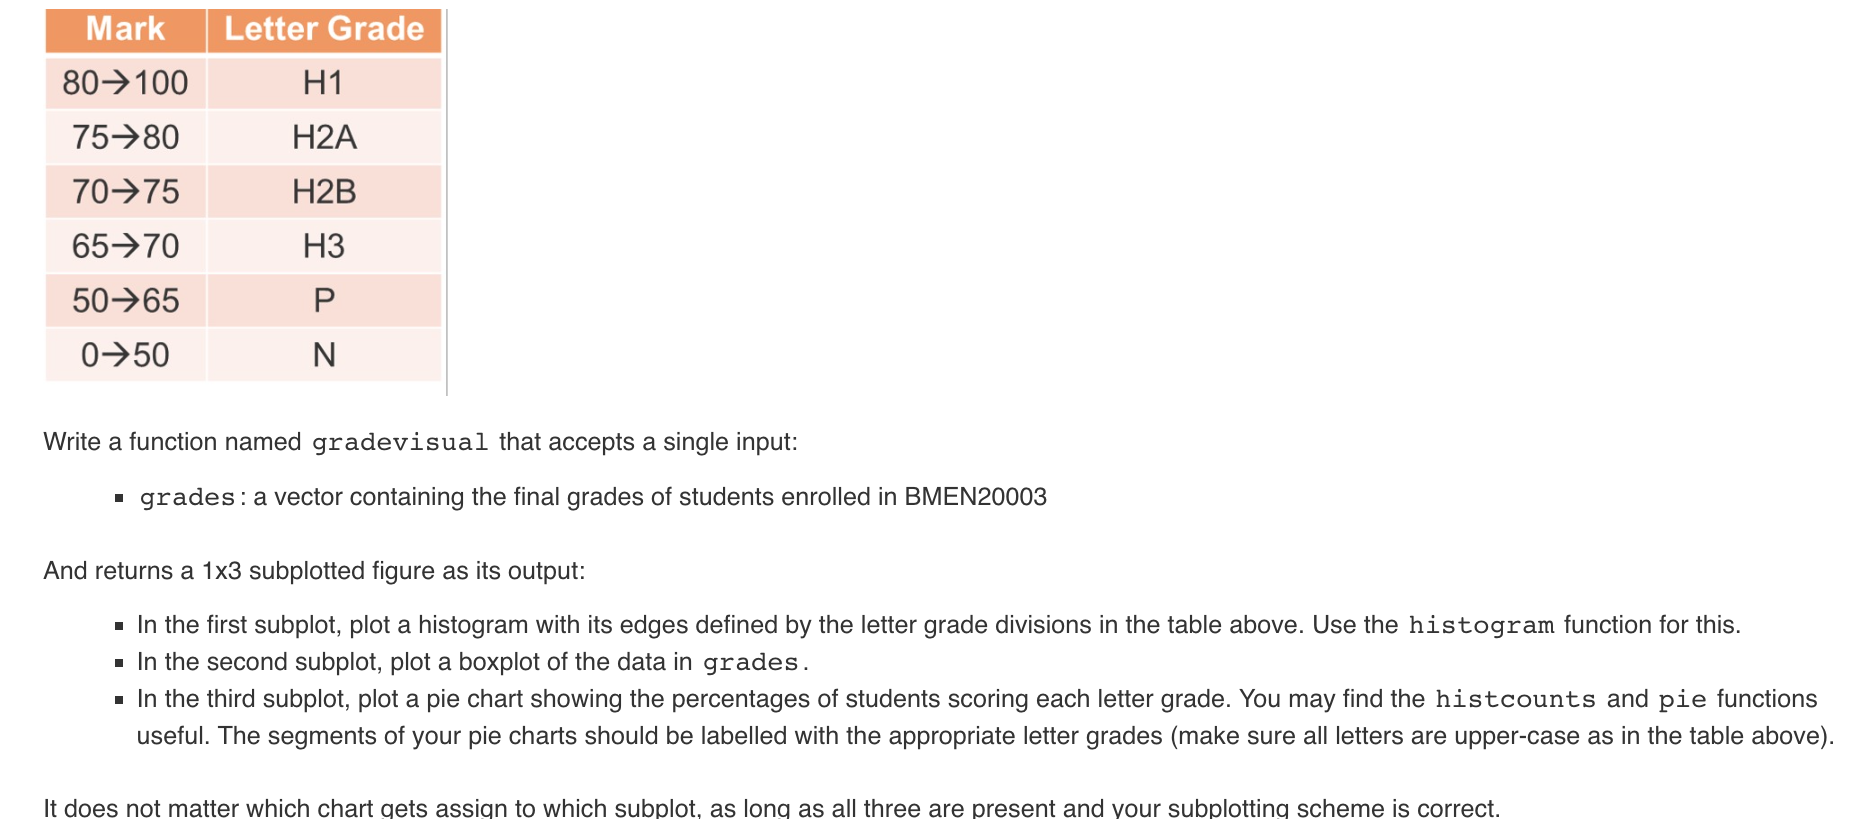
Mark Letter Grade 80>100 H1 75–80 H2A 70–75 H2B 65–70 H3 50–65 P. 0>50 N Write a function named gradevisual that accepts a single input: · grades: a vector containing the final grades of students enrolled in BMEN20003 And returns a 1x3 subplotted figure as its output: • In the first subplot, plot a histogram with its edges defined by the letter grade divisions in the table above. Use the histogram function for this. • In the second subplot, plot a boxplot of the data in grades. • In the third subplot, plot a pie chart showing the percentages of students scoring each letter grade. You may find the histcounts and pie functions useful. The segments of your pie charts should be labelled with the appropriate letter grades (make sure all letters are upper-case as in the table above). It does not matter which chart gets assign to which subplot, as long as all three are present and your subplotting scheme is correct.
1 function gradevisual(grades) 2 3 4 N m n N 00 5 6 7 end 8 Code to call your function 1 grades=[68,83,61,70,75,82,57,15,76,85,62,71,96,78,76,68,72,75,83,83]; 2 gradevisual(grades)
Assessment: Correct output for values in Code to Call Your Function Correct output for randomly generated grades